Display a Visualization Diagram
This page explains how to display Diagram Designer Visualization diagrams in your Evolve Site.
Visualization diagrams are typically used to visually-represent an object and its relationships to other objects, allowing you to see a specific object in context.
However, rather than being a fixed diagram created in CW Modeler, they are automatically generated at the time of viewing.
Visualization diagrams are created as 'layouts' in Diagram Designer. The layout defines which Object Type is the focus of the diagram, which other Object Types and Associations should be shown, and how the diagram should be organized, but it does not specify which object instances should be shown.
In Evolve, you can configure a page to show a diagram generated from one of these layouts, resulting in a dynamically-generated view of an object in context.
You most commonly display Visualization diagrams on Object Pages, where you want a visual representation of the subject of the Object Page. However you can also display them on Index Pages.
|
|
This Help does not explain how to create Diagram Designer layouts. Evolve only supports Diagram Designer layouts which have one object instance as the focus. |
Display a Visualization diagram on your web page
|
|
These instructions detail how to display a Visualization diagram in a new Tab on an Object Page. You can of course show Visualization diagrams in other places, such as below an Association node in a Tab on an Object Page, or below an Object Type node on an Index Page. |
To display a Visualization diagram on your web page:
1. In Evolve Designer, expand the Object Page node where you want your diagram to be displayed
2. Right-click the Tab node and select Add Layout > CW > Diagram
The Layout Diagram node is added.
3. Right-click the Layout Diagram node and select Add Behaviors > Diagram > Visualization (Automatic Diagram)
The Visualization (Automatic Diagram) node is added.
4. Select the Visualization (Automatic Diagram) node and edit the settings:
Use Diagram Design Name to select the Diagram Designer layout you want to use on this page. Only layouts focused on the same Object Type as the Object Page are listed.
Use Display Mode to choose how you want the diagram to be displayed, either constraining it by diagram height, or displayed in full-screen mode.
5. Save and Publish your Site.
Related Topics
Create a Visualization / Automatic Diagram
Display Object Data with Diagram Pop-outs
This page explains how to create and use Diagram Pop-outs to display the data behind objects that appear on diagrams.
|
|
You can use Diagram Pop-outs with all display Layouts in Evolve. See Layouts and Behaviors Explained for a full list of supported Layouts. |
Diagram Pop-outs are used to display information about objects that appear on a diagram.
When a user clicks on an object on a diagram in the Site, a pop-out panel showing the object's details is displayed on the right of the browser window.
Diagram Pop-outs are completely customizable, so you can choose exactly what data you want to show for any given object, and you can even display different pop-outs depending on the Category of the object.
Pop-outs are constructed in a similar way to Object Pages, although you cannot use Tabs, but as such they can include properties of the object, lists of associated objects, as well as some visualizations. Behaviors are not supported in Diagram Pop-outs.
Like Object Pages, Diagram Pop-outs are Object Type specific, so you must create a pop-out for each type of object you want to view the details of.
There are two steps to getting Diagram Pop-outs working on your Site:
1.Create a Diagram Pop-out
2.Configure a page to use a Diagram Pop-out.
|
|
If your Site was created in Evolve 2.2 or earlier, you must enable Diagram Popouts in Evolve Designer before you can create any. To do this: i.Open your Site in Evolve Designer ii.Right-click the Site node and select Add Diagram Popout Node The Diagram Popouts node is added to the bottom of the Site tree. |
What do you want to do?
Create a Diagram Pop-out
To create a Diagram Pop-out:
1. In Evolve Designer, right-click the Diagram Popouts node and select Add Object Page for Object Type > [object type]
A node is added for the Object Type you selected
2. Configure your pop-out to display some object data and/or associations
You configure the pop-out to display data in a similar way to how you build an Object Page, using Property Groups and Associations. However, there is one important difference to an Object Page - you cannot use Tabs.
You can use multiple Property Groups, and you can use multiple Associations.
See here for information on using Property Groups
The Property Group Layout 'FlatList' is particularly useful on Diagram Pop-outs, as it combines multiple properties in a simple display format.
See here for working with layouts and behaviors for Associations
3. When you have completed the configuration of your pop-out, Save it.
|
|
In order for your pop-out to display on a diagram page, you must configure the page to use it. |
Configure a page to use a Diagram Pop-out
Even if you have created a Diagram Pop-out, you must configure individual pages in your Site to use it.
You can display a Diagram Pop-out on any Object Page or Index Page which is configured to display a diagram.
To configure a page to use a Diagram Pop-out:
1. On your page, select the diagram behavior node you want the pop-out to work with
The CW Modeler Diagram, Vector (HTML5), or Visualization (Automatic Diagram) node
2. Use the Diagram Popouts area to choose the pop-outs you want to use for different Object Types that appear on the diagram
Use different rows to specify different pop-outs for different Object Types or Categories of the same Object Type.
i. Use the Object Type drop-down to select the Object Type you want a pop-out for
ii. Use the Category drop-down to select the Category of the Object Type you want the pop-out for - or leave the Category as 'UndefinedValue' if you want your pop-out to apply to all instances of the selected Object Type
iii. Use the Diagram Popout drop-down to select the specific pop-out you want to use for the Object Type and Category combination you have chosen
3. Save and Publish your Site.
Create Category-specific Diagram Pop-outs
You can show different pop-outs for different Categories of the same Object Type.
To do this, create multiple pop-outs for one Object Type, then, when configuring your page to use the pop-outs, choose different pop-outs for different Categories of objects.
If you want to have just one Category of Object Type showing a different pop-out to the others, create a generic pop-out and set it to 'UndefinedValue' on the diagram page, then specify the Category pop-out just for that specific Category.
Display a Diagram on the Home Page of your Static Site
If you publish your Site as a Static Site, you can create a special home page which displays a CW Modeler diagram.
This feature does not work with Dynamic Sites.
To display a diagram on your Static Site home page:
1. Create a new Diagram Index Page
2. Enter 'home' as the Page Name
3. Ensure your page filter is configured so that only one diagram is selected
For example: 'ID = 12'
4. Save and Publish your Site.
Displaying Vector (HTML5) for Displaying Diagrams
This page explains how to display CW Modeler diagrams in Vector (HTML5) format in your Evolve Site.
Vector (HTML5) diagrams introduce a new method for displaying CW Modeler diagrams, bringing increased load performance, better picture quality and perfect scaling.
Use the Vector (HTML5) Diagram display
To use the Vector (HTML5) Diagram display:
|
|
If you want to compare the appearance of the Vector (HTML5) version of your diagram and the original CW Modeler version, you can display both versions in your page. To do this, each diagram must be displayed in a different Tab. Ensure that you enter a specific Layout ID for each. This is a useful way to provide us with feedback about the differences you experience. |
1. Open one of your existing Diagram pages.
2. Add a new behavior to the Layout Diagram node you want to change, ensuring you choose the Vector (HTML5) option.
3. Delete the existing CW Modeler Diagram node.
Support for diagram elements
The Vector (HTML5) diagram behavior supports all diagram elements typically available to CW Modeler diagrams, except for the following:
The following elements are NOT supported:
oAssociation Type Regions
The following elements are PARTIALLY-supported:
oVersion Control (all items except for the Detailed Object section)
oFree Text (only Free Texts referenced on the palette)
|
|
IMPORTANT Vector (HTML5) Diagrams will not correctly display any diagram element where the formatting of the element is applied directly on the canvas. Only formatting applied to items on the New Objects Palette of the corresponding template diagram are displayed correctly. |
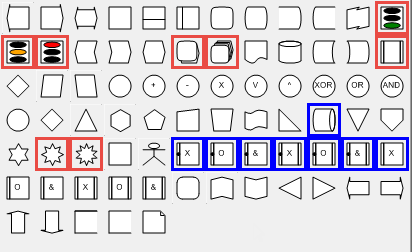
Diagram Shapes
There is partial support for available for the following diagram shapes:
|
RED |
= |
Not Supported |
|
BLUE |
= |
Supported with differences to the original CW Modeler diagram. |
|
|
Please note that due to the rendering limitations of Internet Explorer 9 and 10, using shapes with a dashed outline may prevent the diagram from rendering properly. |
Lines and Connectors
All lines and Connectors are supported.
Shape Regions
The following table shows the support for shape regions:
|
Region |
Level |
|
Label |
Supported |
|
Association Type |
Supported |
|
Association Type (Custom) |
Not supported |
|
Property Value |
Supported |
|
Property Value (Custom) |
Supported |
|
Property Visualization using Reference property |
Supported |
|
Property Visualization using Palette value |
Supported |
|
Explosion with rule and category |
Supported |
|
Property gauge using a reference property |
Supported |
|
Property gauge using Palette |
Supported |
|
Property Gauge as date range |
Supported |
|
Explosion |
Supported |
|
Explosion with rule |
Supported |
|
Navigation |
Supported |
|
|
A yellow triangular ( oIf there is misalignment between the Template Palette and the Diagram Palette. However, the icon will not display if the misaligned objects in the palette use names that have previously been accepted for aligned objects, even if their settings have been changed. oA diagram uses unfinished or missing connectors. Close and reopen the diagram in Corporate Modeler . If the Warning icon remains, this is likely due to another issue. oMissing Shapes create a Broken Layer. Close and reopen the diagram in Corporate Modeler . If the Warning icon remains, this is likely due to another issue. |
|
|
Please be aware that certain fonts are not supported by all browsers. When using the HTML5 Canvas, some fonts will therefore be substituted for alternative styles, depending on your browser type. |
Publishing Static Sites
If you only use the Vector (HTML5) behavior to display diagrams in your Static Site, you can tell Evolve to no longer generate image files of the diagrams in your repository when you publish the Site.
Generating diagram image files is often the most time-consuming part of publishing a Static Site and they are not needed for the Vector (HTML5) behavior, so choosing not to export them can significantly speed up publication.
Use the Export Diagram Images option on the Site node settings to disable diagram image generation.