Tchater maintenant avec le support
Tchattez avec un ingénieur du support

Foglight for Sybase 5.7.5.40 - User and Reference Guide

Using Foglight for Sybase
Exploring the Sybase Dashboards About the Sybase_MDA Agent About the Sybase_RS Agent Generating SybaseMDA Reports
Reference About us

Sybase Alarms Selection

Previous Next


Sybase Alarms Selection

By default this list shows all of the Sybase agents that are configured for this Foglight Management Server.

To view the Sybase alarms:

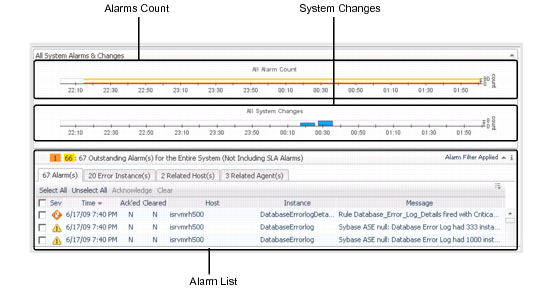
The All Systems Alarms & Changes view appears.

2
Click All Alarms.

The Alarms view appears with three embedded views:

See the Foglight Online Help, Monitoring System-Wide Alarms for details on the alarm information.

Figure 2. Alarms View

Sybase Agent Table

Previous Next


Sybase Agent Table

To view details of the Sybase MDA Agent table, clicking on most fields allows you to drill down for more detailed information.

The Sybase Agent Name table columns are described as follows:

Table 1. Sybase Agent Table

Name

Description

Health

The health of the Sybase Agent Name, based upon the highest severity alarm.

You can click on an Instance Health icon. A TopologyObject aggregateState Summary popup appears, providing further drill downs to:

Agent Name

The name of the Sybase database agent.

You can drill down by clicking on a Sybase agent name:

F

Number of fatal alarms for this Sybase agent. The dwell shows the number of most recent Fatal alarms raised by this agent.

You can drill down by clicking on the alarm number to view the Alarms list. This allows you to browse through the alarms.

C

Number of critical alarms for this Sybase agent. The dwell shows the number of most recent Critical alarms raised by this agent.

You can drill down by clicking on the alarm number to view the Alarms list. This allows you to browse through the alarms.

W

Number of warning alarms for this Sybase agent. The dwell shows the number of most recent Warning alarms raised by this agent.

You can drill down by clicking on the alarm number to view the Alarms list. This allows you to browse through the alarms.

Host Name

Name of the computer which is hosting the Sybase database.

You can drill down by clicking on a host name and then selecting:

Host Monitor—a detailed dashboard for the selected host appears.
Host Browser—a dashboard appears listing the agents running on this host and any alarms for this host.

Agent Status

The operational status of the monitoring agent.

When the agent instance is running, the following status message appears:

When the agent instance is running but not collecting data, one of the following status messages appear:

If you have administrator role permissions, click on the status and then select a command to:

Activate the agent.
Deactivate the agent.
Start Data Collection by the agent.
Stop Data Collection by the agent.
Edit Properties of the agent.

Sybase Version

The Sybase version being monitored.

You can expand the version detail by clicking on any version number.

Up Since

The date and time that the Sybase agent was last restarted.

Sybase Agents Home Pages

Previous Next


Sybase Agents Home Pages

Clicking an agent name on the Sybase MDA Global View Dashboard or Databases Dashboard shows a dashboard containing more information about the selected agent instance. The dashboard that appears in the display area depends on the selected agent type:

MDA Home Page Dashboard

Previous Next


MDA Home Page Dashboard

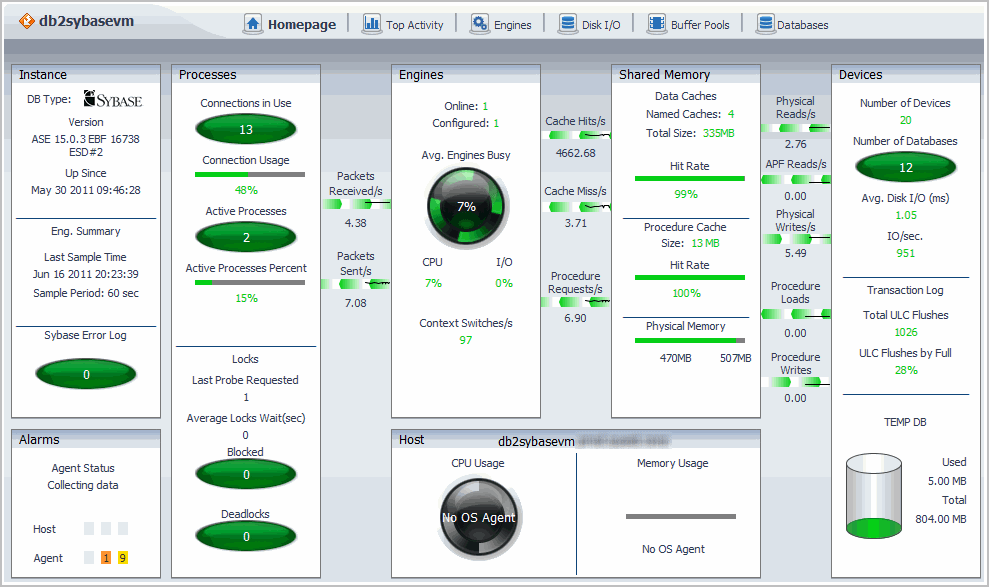
The MDA Home Page dashboard provides performance details for a specific database. The following sub-sections describe the dashboard element metrics:

Drilldown dashboards may be accessed through some of the dashboard element metrics or directly through the dashboard toolbar, where:

Table 2. Drilldown dashboards

Name

Description

Homepage

This link opens the MDA Home Page Dashboard.

Top Activity

This link opens the Top Activity Dashboard.

Engines

This link opens the Engine Activity Dashboard.

Disk I/O

This link opens the Disk I/O Dashboard.

Buffer Pools

This link opens the Buffer Pools Dashboard.

If no data is being collected by the Sybase_MDA agent, the “Not Collecting data” error message appears beside the Sybase agent name. In this case, the dashboard shows the data collected from the last sample time.

Figure 3. Dashboard data

Click a point on the plot line of any metric to zoom in to the corresponding graph. Click a data point on the plot line of the graph to view the corresponding top SQL (displayed on the Top SQL tab of the Top Activity dashboard). For more information, see Top SQL Tab.

Documents connexes

The document was helpful.

Sélectionner une évaluation

I easily found the information I needed.

Sélectionner une évaluation