Replicated Servers Metrics
 |
 |
Replicated Servers Metrics
You can drill down by clicking on this status field. The MDA Home Page Dashboard appears for the appropriate server.
Databases Dashboard
 |
 |
Databases Dashboard
At the top of this dashboard you see the total counts of all alarms generated by all monitored database types, including Sybase. The alarm counts are grouped by the severity level: Fatal, Critical, Warning, Normal, and Unknown. Use this as a starting point to quickly estimate potential bottlenecks within your infrastructure.
Figure 39. Database Dashboard
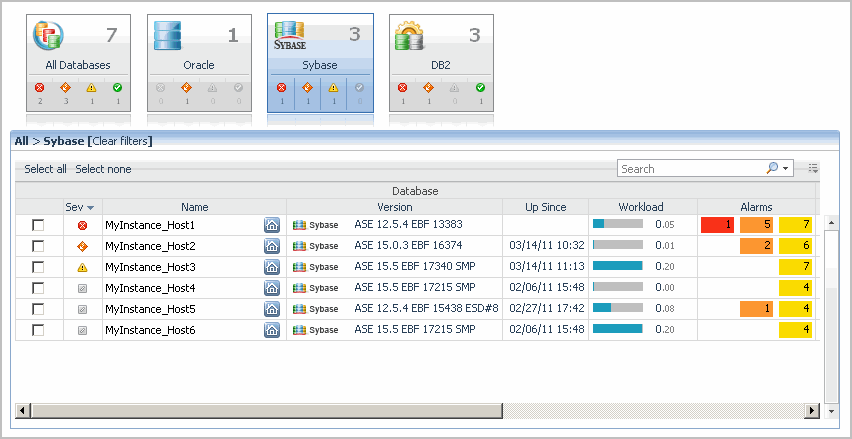
Just below the alarm counts, a collection of tiles displays a high-level overview of your environment. Each tile represents a database type (All, SQL Server, Oracle, Sybase, DB2) and shows how many database instances exist in your monitored environment, along with the count of objects of that type in each of the alarm states (Normal, Warning, Critical, Fatal).
Figure 40. Database Tiles
The table of database instances appearing just below the tile collection reflects the tile selection. For example, clicking the Sybase tile shows only the Sybase databases in the list.
Figure 41. Database Instances
For details about the information appearing in this list, see Viewing the list of database instances.
You can use other types of attributes to filter this list. For example, clicking a severity icon in a tile shows only the database instances of that database type that are in that alarm severity state. For more information about filtering this list, see Filtering the list of database instances.
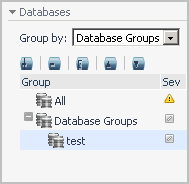
In many cases it may be useful to create one or more groups of databases that you want to monitor. You can use database groups to further filter your selection using the Databases view appearing on the navigation panel.
Figure 42. Database Groups
For additional information about database groups, see Managing database groups.
Clicking the All Databases tile or Clear filters in the table heading shows a list of all monitored database instances.
Clicking any value in the database list, except the Home icon
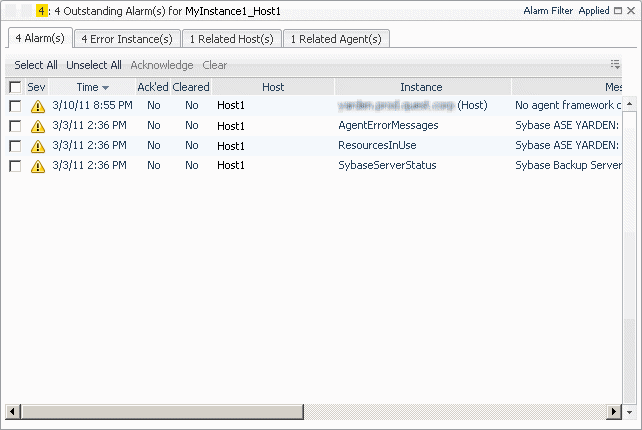
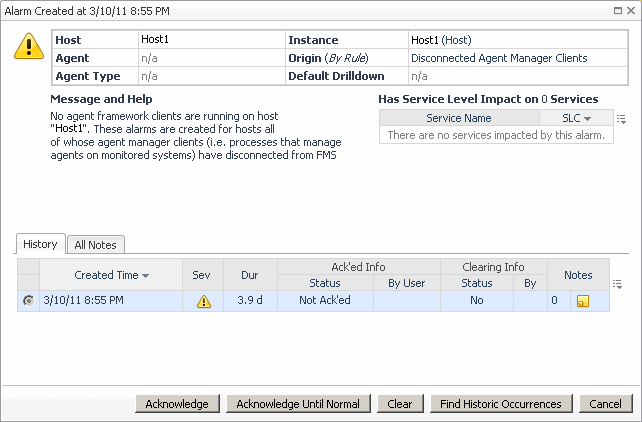
in the Name column, displays a Sybase cue card at the bottom of the display area, showing additional information about the selected database instance. For details about the information appearing in this view, see Exploring the state of selected database instances.
Figure 43. Additional Database Instance Information
Clicking the Home icon
in the Name column links to the MDA Home Page Dashboard.
Viewing the list of database instances
 |
 |
Viewing the list of database instances
The table of database instances can display all available database instances, or a filtered list. For more information about possible filters, see Filtering the list of database instances.
Filtering the list of database instances
 |
 |
Filtering the list of database instances
To filter the list of database instances:
The list of databases refreshes, showing only the entries that match the specified filter.


