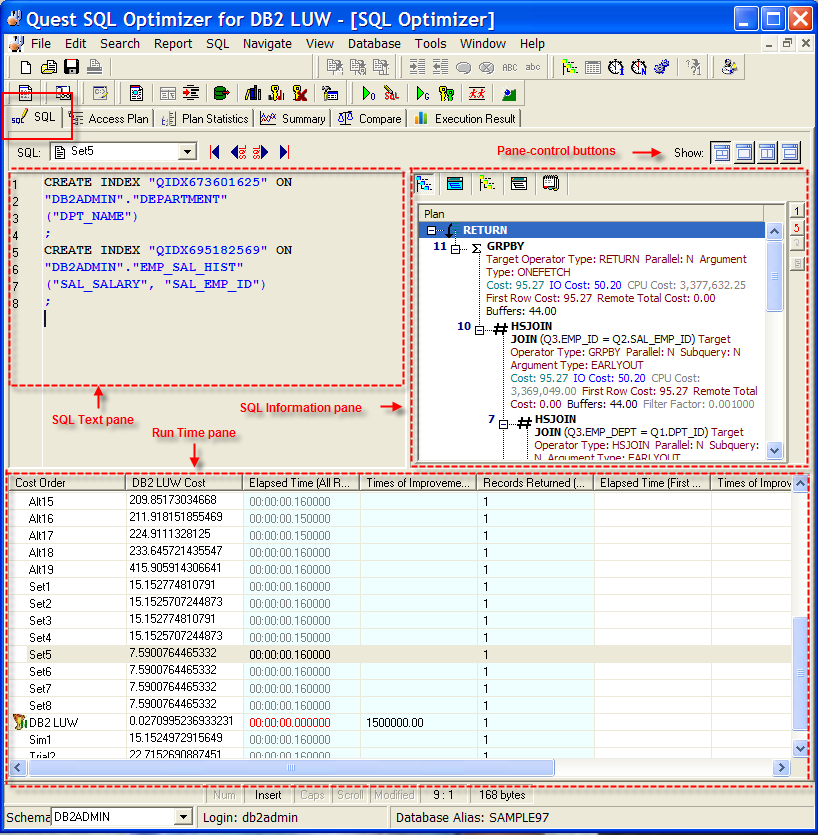
The SQL tab in the SQL Optimizer window consists of three panes: SQL Text, SQL Information and Run Time.
On this tab, perform any of the following:
Enter or edit the original SQL statement. (See Enter or Edit the Original SQL Statement.)
Review the access plan for the original SQL and for each SQL or index-set alternative.
Review the run-time statistics after all alternatives are batch-executed.
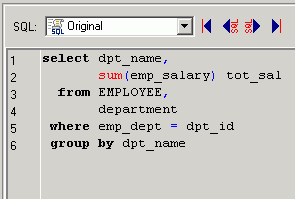
Use the SQL Text pane to view the original SQL statement syntax or the SQL associated with a specific SQL alternative. For an index-set alternative, view the index DDL. You can also use this pane to enter or edit the text of the original SQL statement or to enter the text of an SQL alternative you are manually creating.
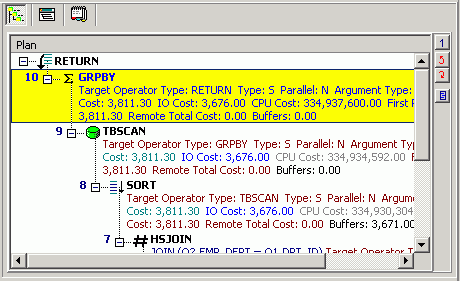
Use the SQL Information pane to toggle between the access plan or the DB2 optimized text for the original SQL or an alternative. You can also view information about the original SQL.
The Run Time pane displays the SQL or index-set alternatives automatically generated or created manually on the original SQL. Use the SQL Navigation buttons to move between alternatives. When you perform a Batch Run, this list shows the run time statistics for retrieving all records and for retrieving the first n records for the original SQL and each alternative.
Use the pane-control buttons to reorganize the panes:
To display the SQL Text, SQL Information, and Run Time panes
Click .
To display only the SQL Text pane
Click .
To display the SQL Text and SQL Information panes
Click .
To display the SQL Text and Run Time panes
Click .

Use the SQL Text pane to do any of the following:
When a SQL statement is sent to this pane from other modules, the optimization process begins automatically (if you have selected .
Notes:

The SQL Information pane shows types of information for the original SQL or the SQL associated with the currently selected alternative. Use the buttons across the top of the pane to toggle between the views.
Note: Different SQL Optimizer modules use the SQL Information pane. The buttons available in the pane depend on the module you are using.
|
Button |
Function |
Description |
|---|---|---|
|
|
Show the corresponding virtual access plan. Notes:
| |
|
|
Virtual DB2 Optimized Text
|
If the SQL statement is valid, show the corresponding virtual DB2 optimized text. Note: No information displays if the SQL statement in invalid. |
|
|
Display the access plan. Notes:
Tip: Click | |
|
|
Display the SQL statement reconstructed by the DB2 LUW optimizer after it retrieves the access plan. Note: In the Scanner SQL Viewer, the optimized text for both the bound plan and the current plan display. | |
|
|
Information |
Show any of the following, depending on the specific function using this pane:
|
|
|
Scanner Temp Table (SQL Scanner only) |
Display the temporary table SQL statement assumed to create or modify the temporary table used on the scanned SQL statement if the SQL Scanner finds it in the source code. |
|
|
(SQL Scanner only) |
Display the date and time when the SQL statement was checked, its status and description, and the name of person who checked the SQL. |

The Run Time pane in the SQL and Statistics pages in the SQL Optimizer window lists the current SQL and index-set alternatives generated for the original SQL. The following shows for each alternative.
Notes:
|
Item |
Description |
|
The order of alternatives is initially based on the ascending order of DB2 LUW Cost. The original SQL statement will always be the first item on the grid. | |
|
DB2 LUW Cost |
The cost value provided by DB2 LUW as an estimate of performance. Note: The lower the DB2 LUW cost, the better the estimated performance of the SQL statement. However, the cost value should not be used as the actual indication of performance. It is best to execute the alternatives to find which performs the best in your database environment. |
|
The elapsed time for all records shows the actual elapsed time required to retrieve all records from the database. The calculation of the run time is based on the CPU time of the database server. Thus network traffic is excluded from the time. If the SQL statement is used to retrieve all the records from the database, such as reports or batch processes, the SQL statement with the best elapsed time for all records should be used as a criteria for selecting the alternative. | |
|
The times of improvement shows how many times faster the alternative is for retrieving all records than the original SQL statement. | |
|
Records Returned (All Records) |
The number of records indicates the total number of records influenced by the alternative. This figure should remain constant throughout the original and optimized SQL statements. |
|
Elapsed Time (First n Records) |
The elapsed time for the first record indicates the time it takes for the first record to be returned from the SQL statement. For some on-line retrieval screens, interactive applications, or processes that do not retrieve all records from the SQL statement at once, the best elapsed time for retrieving the first record should be used as a criteria for selecting the best alternative. |
|
Times of Improvement (First n Records) |
The times of improvement shows how many times faster the alternative is for retrieving the first record than the original SQL statement. |
|
Records Returned (First n Records) |
The first record retrieved, this figure should be 0 or 1. |
|
Information from the Batch Run is included in this column. It includes:
|