Tchater maintenant avec le support
Tchattez avec un ingénieur du support

Foglight for Storage Management Shared 4.8.5 - User and Reference Guide

Getting Started Configuring Agents to Monitor Storage Devices
Brocade SAN Switches Cisco SAN Switches Dell Compellent Arrays Dell EqualLogic PS Series Array Groups EMC CLARiiON CX Series Arrays (CLI) EMC CLARiiON, VNX, or VMAX Storage Arrays (SMI-S) EMC Isilon EMC VPLEX Hitachi Data Systems AMS, USP, and VSP HP EVA Storage Arrays HP 3PAR Arrays NetApp Filers Configuration Procedures
Managing Agents Using Foglight for Storage Management Monitoring Storage Performance Investigating Storage Devices Investigating Storage Components Investigating VPLEX Storage Troubleshooting Storage Performance Managing Data Collection, Rules, and Alarms Understanding Metrics Appendix: Collection Target Support Matrix Online-Only Topics

Troubleshooting Storage Performance

Administrators may receive problem reports from stakeholders about the performance of a VMware virtual machine (VM). When the suspected cause is storage, the Administrator can run an automated analysis using the Storage Troubleshooting dashboard. The analysis can quickly rule out a storage issue, allowing the Administrator to focus on other areas. Conversely, if a storage issue is found to be contributing to poor performance, the results of the analysis clearly highlights the datastores or RDM disk extents that require attention.

This section is intended for Foglight for Storage Management users with the role of Storage Administrator. It describes how to start an investigation, analyze the results, and change latency thresholds. It also summarizes the algorithm used to identify and assess storage performance issues.

This section describes the following topics:

Starting a Troubleshooting Investigation

Before beginning an investigation, you should ask the person reporting the issue the following questions:

1
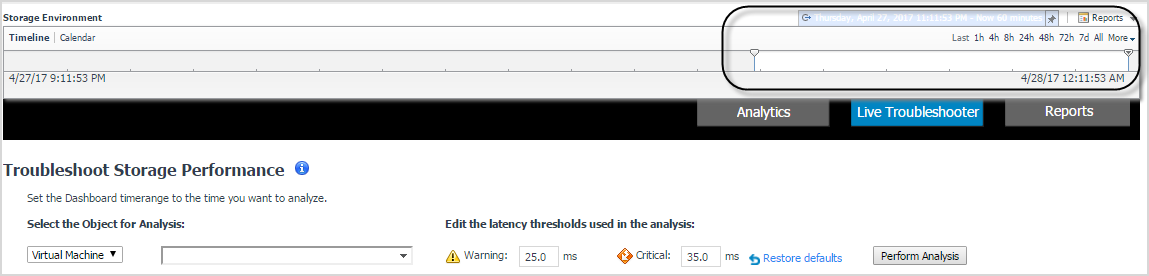
On the navigation panel, under Dashboards, click the Insights tab, and then click Live Troubleshooter.
5
Click Perform Analysis.
If a Normal icon appears in all title bars, the performance issue is not storage-related. This investigation is complete.
If the Attention icon appears in one or more title bars, continue your investigation following the workflow described in Analyzing Storage Issues.

Analyzing Storage Issues

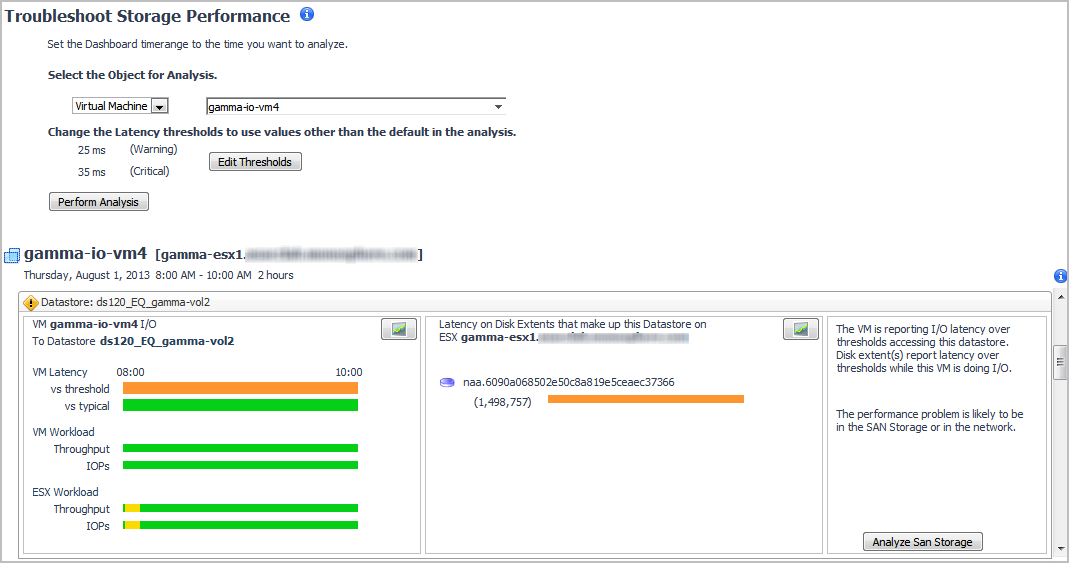
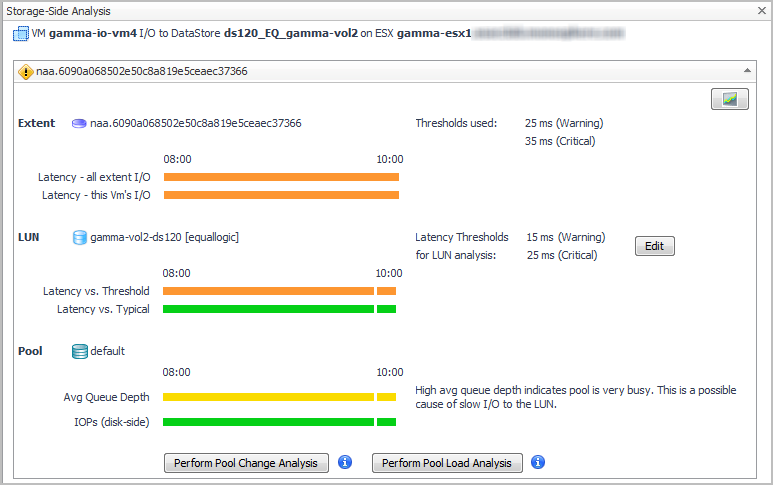
If the view for a datastore or RDM disk extent shows the Attention icon, the troubleshooting algorithm has discovered evidence of a performance problem related to storage. The problem may or may not be in the SAN Storage environment. Review the details to determine the cause of the performance issue.

Each datastore/RDM view has three summary panels (from left to right):

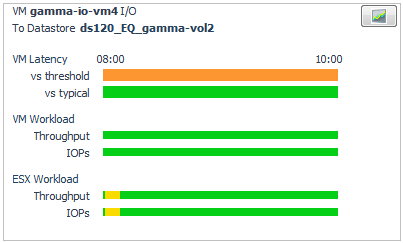
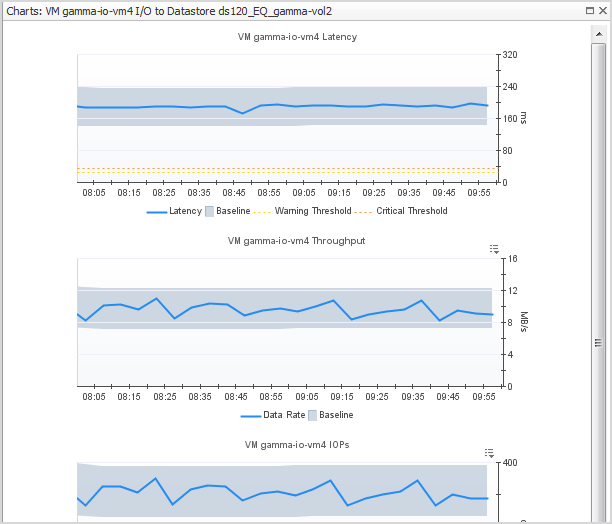
A virtual machine may be connected to multiple datastores and RDM disk extents, each of which may report varying degrees of problems. When a virtual machine has more than one datastore/RDM view, start by scanning the timeline bars in the VM I/O to Datastore/RDM panel to identify a datastore/RDM with consistently slow I/O performance or significant changes from typical performance.

The following workflow describes one way to identify a latency problem in the collected SAN Storage environment. While the details in your investigation may differ, the general workflow should be similar to this one.

1
In a view showing the Attention icon, scan the VM I/O to Datastore/RDM summary (first panel). Look for timeline bars that primarily show colors such as yellow, orange, or pink, that is, any color other than green (which represents acceptable activity).
2
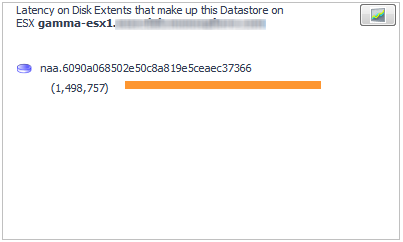
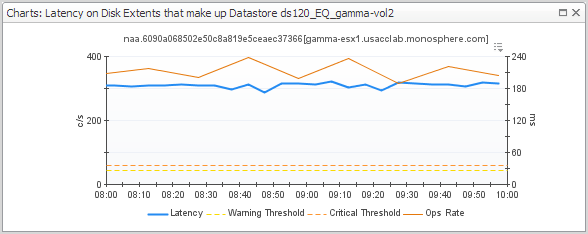
Now look at the Latency for Disk Extents summary (middle panel) to identify the disk extents that are contributing to the problem.
a
In the VM I/O to Datastore/RDM summary, click the Chart icon.
c
In the Latency for Disk Extents summary, click the Chart icon.
5
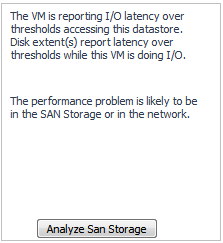
In the Diagnosis panel, click Analyze SAN Storage.

Analyzing the Pool

When pool timeline bars show abnormal average queue depth or ops rate, analyze the changes within the pool and the load on the pool.

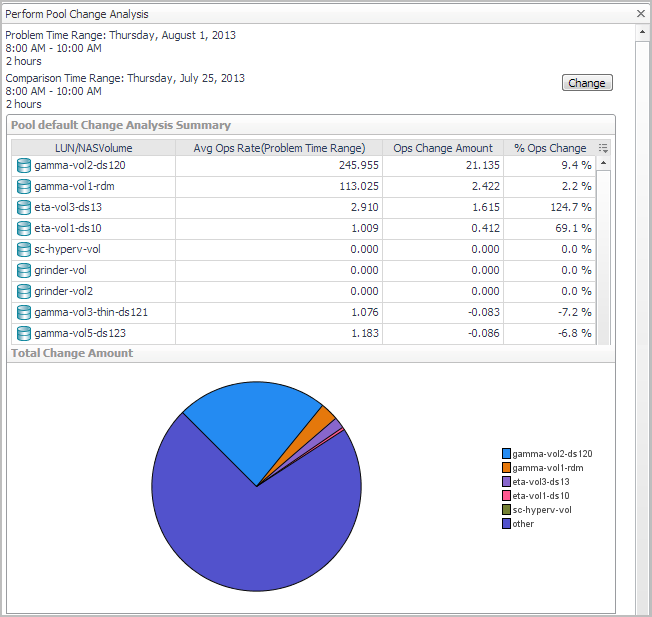
Perform Pool Change Analysis. The Pool Change analyzer identifies the LUNs primarily responsible for increased I/O. It compares LUN activity in the problem time range with LUN activity during the same time range in the past. Changes are reported in terms of average operations rate and change amount.
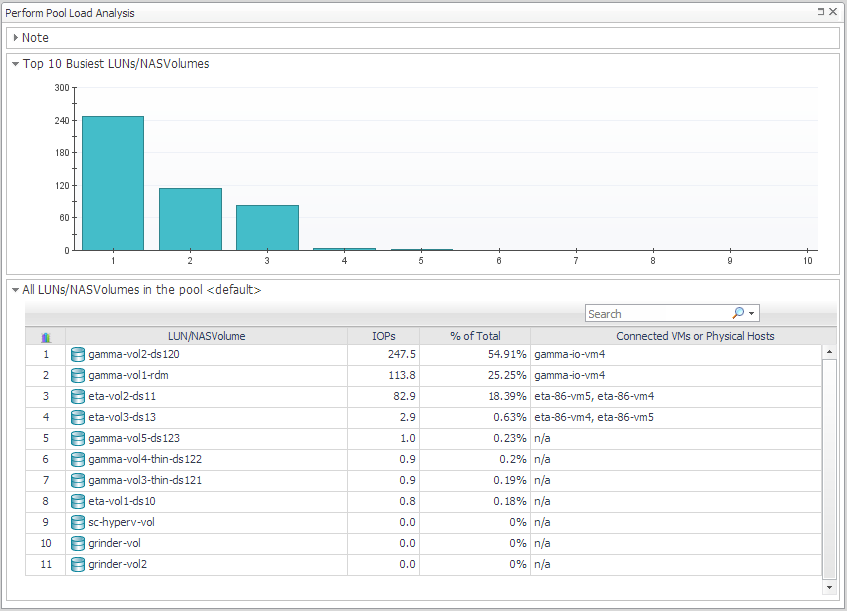
Perform Pool Load Analysis. The Pool Load analyzer identifies the busiest LUNs and ranks them based on their activity during the same time range over the last 30 days (not the current time frame). Activity is measured in operations per second.
TIP: You can change the comparison time range by clicking Change and selecting a new date and time range.
3
Click Perform Pool Load Analysis.
Documents connexes

The document was helpful.

Sélectionner une évaluation

I easily found the information I needed.

Sélectionner une évaluation