
Getting Started
Introducing Foglight for Storage Management
Navigating Foglight for Storage Management
Introducing the Storage Monitoring Architecture
Sizing Your Monitored Environment
Ensuring System Requirements are Met
Configuring Agents to Monitor Storage Devices
Small Environment System Requirements
Large Environment System Requirements
Requirements for Agent Managers
Installed Dashboards and Cartridges
Configuring Agent Managers for Storage Collection
Installing External Agent Managers
Creating a Lockbox for Foglight for Storage Management Credentials
Supporting an Environment with Separate Fabrics that have Duplicated WWNs
Configuring Storage Collector Agents
Configuring VMware Performance Agents
Configuring Hyper-V Agents
Assigning Foglight for Storage Management Roles
Brocade SAN Switches
Cisco SAN Switches
Managing Agents
Requirements for Cisco SAN Switches
Ensuring that SSH is Enabled on Switches
Configuring Agents to Monitor Cisco SAN Switches
Dell Compellent Arrays
Dell EqualLogic PS Series Array Groups
EMC CLARiiON CX Series Arrays (CLI)
Requirements for EMC CLARiiON CX Series Arrays (CLI)
Configuring Agents to Monitor EMC CLARiiON CX Series Arrays (CLI)
EMC CLARiiON, VNX, or VMAX Storage Arrays (SMI-S)
Requirements for EMC CLARiiON or VNX Arrays (SMI-S)
Requirements for EMC VMAX Arrays (SMI-S)
Configuring Agents to Monitor EMC Storage Arrays (SMI-S)
Configuring the SMI-S Provider for EMC CLARiiON or VNX
Verifying Statistics Logging is Enabled on EMC Arrays
EMC Isilon
EMC VPLEX
Hitachi Data Systems AMS, USP, and VSP
Requirements for Hitachi Data Systems AMS, USP, VSP
Configuring Agents to Monitor Hitachi Data Systems AMS
Configuring Agents to Monitor Hitachi Data Systems USP and VSP Arrays
HP EVA Storage Arrays
HP 3PAR Arrays
Requirements for HP 3PAR Arrays
Enabling the SMI-S Provider
Configuring Agents to Monitor HP 3PAR Arrays
NetApp Filers
Configuration Procedures
Configuring Agents to Monitor Storage Devices
Assigning Credentials
Creating and assigning new credentials
Selecting and assigning an existing credential
About releasing the Agent Manager lockbox
Resolving Connection Attempt Errors
Configuring the Hitachi Tuning Manager
Configuring Generic SMI-S Array Agent to Monitor Storage Devices
Managing certificates
Reviewing the Status of Configured Storage Collector Agents
Reviewing Agent Alarms
Editing Configured Agents
Using Foglight for Storage Management
Reviewing Agent Status and Validating Connectivity
Managing Credentials
Managing Discovered Switches and Arrays
Managing CLARiiON Domains and Arrays
Managing the Hitachi Tuning Manager
Deploying Storage Agents after an Upgrade
Verifying StorageCollector/Generic SMIS Storage Agents are Collecting Storage Data
Understanding Metric Data in Charts and Tables
Modifying and Extending Data Collection
Next Steps
Monitoring Storage Performance
Introducing the Storage Environment Dashboard
Monitoring Your Storage Environment
Investigating Storage Devices
Understanding Status, Alarms, and Rules in Foglight for Storage Management
Reviewing the Status of All Devices
Assessing Storage Alarms
Monitoring Fabrics
Monitoring Storage Arrays
Monitoring Filers
Asking Questions About the Monitored Storage Environment
Assessing Connectivity and I/O Performance
Introducing the Virtualization Dashboards
Summary of Icons Used in Topology Diagrams
Exploring Connectivity with SAN Topology Diagrams
Exploring I/O Performance with SAN Data Paths
Monitoring Storage Capacity
Capacity Trending
Evaluating Pool Capacity
Environment Summary/Monitoring/Summary
Capacity Reports
Low Capacity Rule
Storage Capacity tab
Creating Storage Reports
Introducing the Storage Explorer
Exploring a Fabric
Exploring a Switch
Exploring a Cisco VSAN
Exploring a Filer
Exploring a Storage Array
Investigating Storage Components
Non-Clustered Storage Arrays
Dell EqualLogic Storage Array
EMC VPLEX Storage Array
EMC Isilon Storage Array
Common Data for Filers and Storage Arrays
Introducing Storage Component Dashboards
Investigating an Aggregate
Investigating an Array/Filer Port
Investigating a Controller
Investigating a Directory
Investigating an EqualLogic Member
Investigating an FC Switch Port
Investigating an Isilon Node
Investigating a LUN
Investigating a NASVolume
Investigating a Physical Disk
Investigating a Pool
Investigating VPLEX Storage
Pool belonging to a non-clustered storage array or EqualLogic storage array
Pool belonging to an Isilon storage array
Common Component Disk Tab Data
Introducing VPLEX Virtualization Components Dashboards
Investigating Director - Ports
Investigating a Virtual Volume
Investigating a Storage Volume
Troubleshooting Storage Performance
Starting a Troubleshooting Investigation
Analyzing Storage Issues
Analyzing the Pool
Changing Latency Thresholds
Understanding the Troubleshooting Algorithm
Managing Data Collection, Rules, and Alarms
Collecting Virtual Storage-to-SAN Relationships
Inferring Physical-Host-to-Storage Relationships
Understanding Metrics
Enabling Dependency Processing
Reviewing and Editing Host-Port Assignments
Running Dependency Processing Manually
Customizing Helper Strings for Dependency Processing
Reviewing Inferred Hosts
Modifying Data Collection Schedules
Understanding Data Collection Types and Schedules
Modifying Data Collection Schedules for Storage Collector Agents
Managing Foglight for Storage Management Rules
Managing Alarm Settings
Troubleshooting Database Limits
Units of Measurement
Performance Metrics
Appendix: Collection Target Support Matrix
Online-Only Topics
Fabrics and FC Switches — Performance Metrics
Storage Arrays and Filers — Disk I/O Performance Metrics
Clustered Storage Arrays — Network Performance Metrics
Capacity Metrics
Storage Arrays — Array, Member, and Pool Capacity Metrics
Filers — Filer and Aggregate Capacity Metrics
Storage Arrays and Filers — LUN, NASVolume, and Disk Capacity Metrics
Overview of Metrics in Foglight for Storage Management
Pool belonging to a non-clustered storage array or EqualLogic storage array
|
2 |
Review overall performance in the Summary tab. From here you can initiate further analysis of the pool in terms of performance and, in some cases, pool capacity. |
|
• |
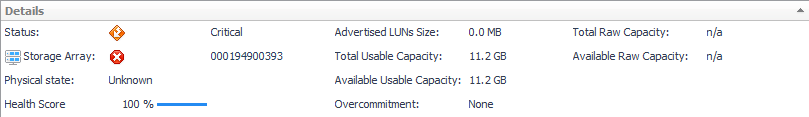
Details. Displays the pool’s status, parent storage array, physical state, health score, and current values for Total Advertised LUNs Size, Total Usable Capacity, Available Usable Capacity, Overcommitment, Total Raw Capacity, and Available Raw Capacity, if available. |
|
• |
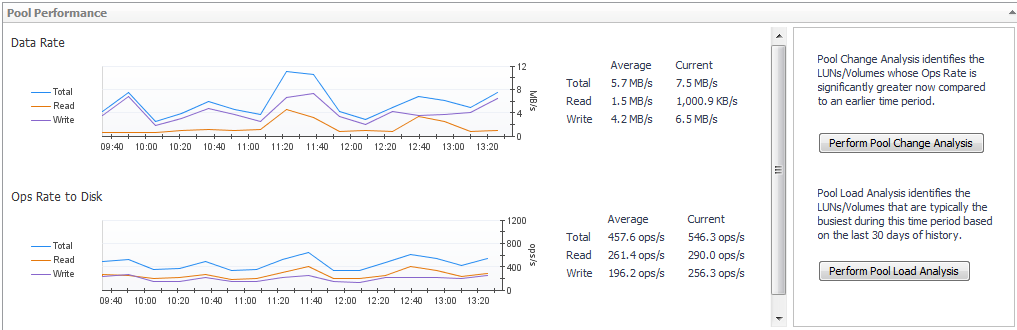
Charts. Displays the following sets of metrics over the time period, if available: |
- Data Rate. Plots values for Data Rate, Data Read Rate, and Data Write Rate.
- Ops Rate to Disk. Plots values for Ops Rate, Read Ops Rate, and Write Ops Rate.
- Latency. Plots values for Latency, Read Latency, and Write Latency.
- Average Queue Depth. Plots values for Average Queue Depth.
- Ops Rate to Disk. Plots values for Ops Rate, Read Ops Rate, and Write Ops Rate.
- Latency. Plots values for Latency, Read Latency, and Write Latency.
- Average Queue Depth. Plots values for Average Queue Depth.
|
• |
Perform Pool Change Analysis. Click to identify the LUNs primarily responsible for increased I/O. For more information, see Analyzing the Pool. |
|
• |
Perform Pool Load Analysis. Click to identify the busiest LUNs, and rank them based on their activity during the same time range over the last 30 days. For more information, see Analyzing the Pool. |
|
• |
Alarm Summary. Displays alarms on the pool. |
|
3 |
Click the Capacity tab. |
|
• |
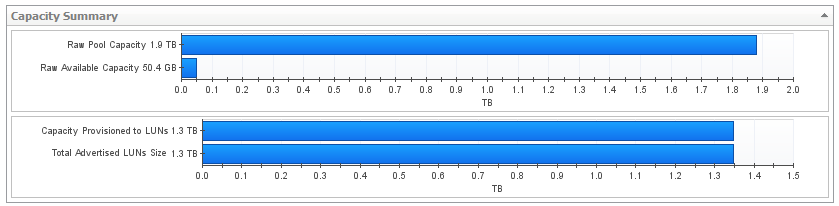
Capacity Summary. Pools in most arrays will display data similar to the data shown below.  |
|
• |
Capacity Usage Trends. Provides a visual display of the estimated capacity consumption in the future, based on a regression analysis of the historical capacity consumption. |
If time until full shows n/a, it means enough historical data hasn't been collected yet to perform an analysis. Mouse over for additional information. For more information, see Capacity Trending.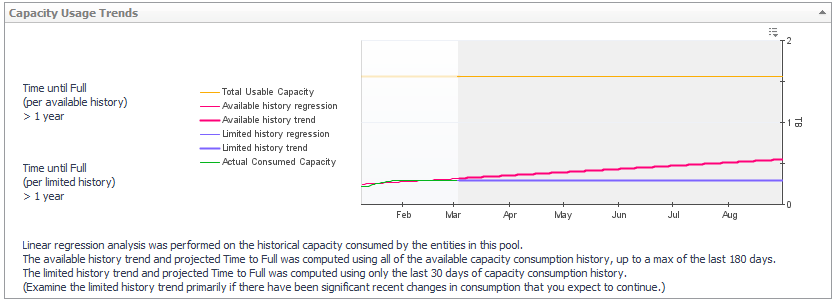
|
4 |
Click the LUNs tab. This tab displays the LUNs carved from this pool. |
|
• |
Top 5 LUNs. Displays the top five LUNs with the highest average value for Data Rate, and the performance metrics most useful for this array or filer. |
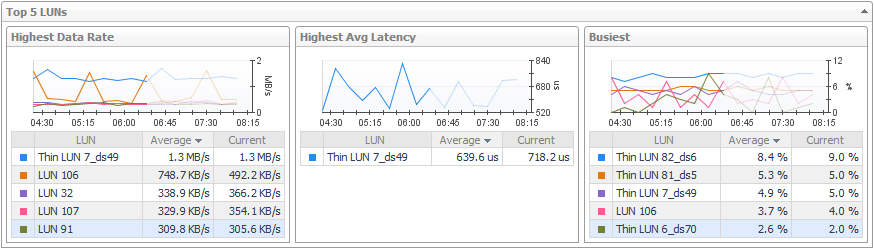
|
• |
LUN Status Filter. Click to show only LUNs with the selected status in the LUN Details table. |
|
• |
LUN Details. For each LUN, displays its status, physical state, parent pool or aggregate, and whether the LUN is used by an entity in the monitored environment. The metric columns display current values for Data Rate, Ops Rate, Latency, % Busy, Average Queue Depth, L1 Cache Hit Rate, and Total Advertised LUNs Size. Click a |
The remaining columns provide the following details:
- Protection. Displays the type of protection in use on the LUN, such as the RAID level.
- Thin?. Indicates whether the LUN is thin-provisioned (true) or thick-provisioned.
- IQN. Displays the iSCSI Qualified Name. Click the Customizer to add this column.
- vFiler. Filers only. Displays the name of the virtual filer associated with the LUN.
- Protection. Displays the type of protection in use on the LUN, such as the RAID level.
- Thin?. Indicates whether the LUN is thin-provisioned (true) or thick-provisioned.
- IQN. Displays the iSCSI Qualified Name. Click the Customizer
- vFiler. Filers only. Displays the name of the virtual filer associated with the LUN.
|
• |
Alarm Summary. Displays alarms on LUNs. |
|
5 |
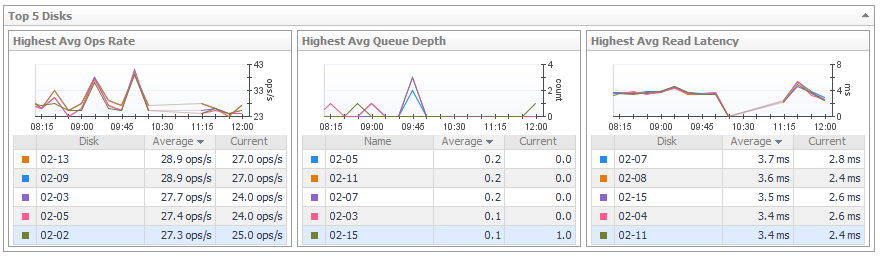
Click the Disks tab. |
Displays the disks used by the selected pool. For more information, see Common Component Disk Tab Data.
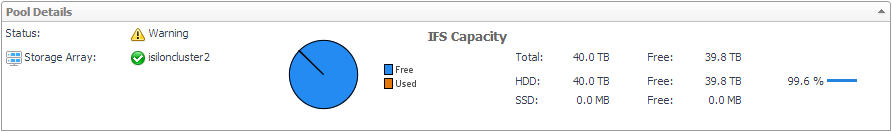
Pool belonging to an Isilon storage array
|
2 |
Review overall performance in the Summary tab. |
|
• |
Pool Details. Displays the pool’s status, parent storage array, and current values for IFS Capacity: Free and IFS Capacity Used for the IFS file system. In addition, the total capacity is broken down into hard disk drive and solid state drives metrics as follows: |
- Total. IFS Capacity: Total and IFS Capacity: Free
- HDD. IFS Capacity: HDD Total and IFS Capacity: HDD Free
- SSD. IFS Capacity: SDD Total and IFS Capacity: SDD Free
- HDD. IFS Capacity: HDD Total and IFS Capacity: HDD Free
- SSD. IFS Capacity: SDD Total and IFS Capacity: SDD Free
|
• |
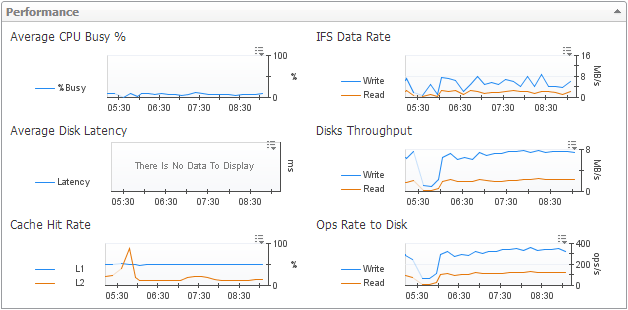
Performance. Charts plot the following metrics for the selected pool over the time period: % Busy, Latency, L1 Cache Hit Rate, L2 Cache Hit Rate, Data Read Rate, Data Write Rate, Read Ops Rate, and Write Ops Rate. |
|
• |
Node Status Filter. Click to show only member nodes with the selected status in the Node Details table. |
|
• |
Node Details. For each node belonging to the pool, displays its name, status, physical state, and current values for Data Rate, % Busy, Latency, L2 Cache Hit Rate, IFS Capacity, and IFS Capacity: Free. Also displays the worst status of the node’s disks, external network ports, and internal network ports, and identifies the node’s parent pool. Click a |
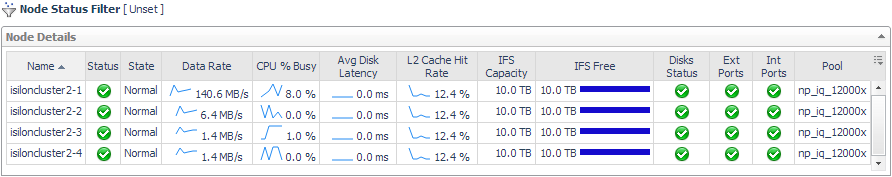
You can add the following metrics to the table by clicking the Customizer icon:
L1 Cache Hit Rate, Send Data Rate and Rcv Data Rate. You can also choose to display other Isilon details, such as Total Disk IOPS and Model.
L1 Cache Hit Rate, Send Data Rate and Rcv Data Rate. You can also choose to display other Isilon details, such as Total Disk IOPS and Model.
|
• |
Alarm Summary. Displays alarms on the pool. |
|
3 |
Click the Capacity tab. |
|
• |
Capacity Usage Trends. Provides a visual display of the estimated capacity consumption in the future, based on a regression analysis of the historical capacity consumption. |
If time until full shows n/a, it means enough historical data hasn't been collected yet to perform an analysis. Mouse over for additional information. For additional information, see Capacity Trending.
|
4 |
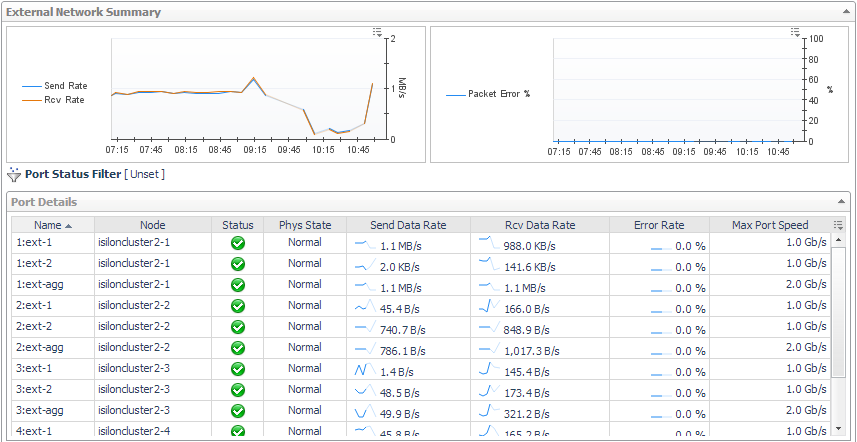
Click the Network tab. Assess the performance of the ports in the External Network from the perspective of the pool. |
|
• |
Charts. Plot aggregated values for Send Data Rate and Rcv Data Rate, and Packet Errors % for the external network connections over the time period. |
|
• |
Port Status Filter. Click to show only ports with a selected status in the Port Details table. |
|
• |
Port Details. For each port used by the external network, identifies the port name, parent node, status, physical state, and current values for Send Data Rate, Rcv Data Rate, and Packet Errors %. Also displays the maximum speed of the port. Click a |
|
NOTE: When the registry variable StSAN_StoragePortShowUtilMax is set to show port utilization, the chart and table display Rcv Util (% of max) and Send Util (% of max). |
|
• |
Alarm Summary. Displays alarms on ports used by the external network. |
|
5 |
Click the Disks tab. Displays the disks used by the selected pool. For more information, see Common Component Disk Tab Data. |
Common Component Disk Tab Data
The Disks tab can be found on the following dashboards:
|
• |
The Disks tab displays the physical disks associated with the selected entity.
|
• |
Top 5 Disks. Displays the top five disks with the highest average value for Ops Rate and the performance metrics most useful for this array or filer. |
|
• |
Disk Status Filter. Click to show only disks with the selected status in the Disk Details table. |
|
• |
Disk Details. For each disk, identifies its status, physical state, parent pool or aggregate, and Disk Size, and then displays current values for Ops Rate, % Busy, Average Queue Depth, Data Rate, and Latency. Click a |
The remaining columns provide the following details:
- Role. Displays the role played by the disk in the pool, such as disk or spare.
- RPM. Displays revolutions per minute as reported by the vendor.
- Disk Interface. When available, displays the type of interface, such as SATA or SCSI.
- Member. EqualLogic and Isilon only. Displays the name of the member node where the disk physically resides.
|
• |
Alarm Summary. Displays alarms on disks. |