Specific user process monitoring is available beginning with Infrastructure Cartridge 5.7.0 (for Windows agent) and 5.8.1 (for Unix agents) versions and higher.
Infrastructure Agent Properties Configuration
For Windows agents:
- Navigate to Agent Status Properties of the agent.
- Search for "Process Availability Config" property.
- Click "Edit" and update the property list with the specific user process name, command line and expected process count to be monitored.

Note: The Process Name matches an exact string (case sensitive), while a regular expression can be used for the Command Line. The command line can be obtained from the Windows Task Manager by enabling the Command Line column in the Processes tab.
For Unix agents:
- Navigate to Agent Status Properties of the agent.
- Enable / Disable "Collect declared processes only" option.
- When the parameter is disabled
- All collected processes are reported
- Alarms are raised for processes with lower than expected instance count. Expected Instance Count must be greater than 0.
- If a process is added to the 'Process Availability Config' secondary ASP with expectedCount
- When the parameter is enabled
- Only declared processes in 'Process Availability Config' Secondary ASP are reported
- Alarms are raised for processes with lower than expected instance count. Expected Instance Count
- If a process is added to the 'Process Availability Config' Secondary ASP with expectedCoun
- Edit the Process Availability Config property with the specific user process name, command line and expected process count to be monitored.

Note: The Process Name matches an exact string, while a regular expression can be used for the Command Line. The command ps -e -o pid,user,comm,command can be used to obtain the process name and command line from the monitored host.
How to monitor processes of Virtual machines
You can configure one Infrastructure MultihostAgent to monitor N Virtual Machines, please check the following guide for more information:
MultiHostProcessMonitor Agent configuration SOL176965
Process Rules Available
Rule: Process Availability
Default status:Active
Description: This rule checks that processes listed in the "Process Availability Config" ASP are running as expected.
This rule is meant to alarm when no instances of the named process are running.
Rule: Number of Processes
Default status:Active
Description: This rule determines if host is demonstrating an abnormal number of processes.
Rule: Process Exist Count
Default status: Disabled, and replaced by "Number of Processes" rule
Description: This rule checks that the expected number of processes in the "Process Availability Config" ASP are running on the host
This rule is meant to alarm if some are running, but less than the specified count
There are 2 situations exposed:
- When the instance count > 0, the "Process_Availability" will check if (currentCount/expectedCount )*100% is below the threshold. Fatal 30%, Critical 60%, Warning 90%. They are defined as "INF_ProcessAvailabilityxxx" registry variables.
- When the instance count is 0, the "Process_Availability" rule won't be triggered as there is no instance to be evaluated, "Process_Count" will take charge of this. It will check each "OperatingSystem" object and find the processes that is declared in agent properties and have 0 instances currently, then it fires a Fatal alarm under "Process_Availability" rule (the alarm message is defined in its condition codes) . This should be why the message customer receives doesn't match to any content defined in "Process_Availability" when the instance count is 0.
If you want to double-check specific Process Instance Count, do the following:
Go to Dashboards | Administration | Tooling | Script Console
On the textbox near to "List Instance" type "HostProcess", then click "List Instances", in the right hand type a process filter. In this example I used cmd.exe. Then on the lower textbox type the word "instanceCount".
This is will return information about the instanceCount number.

In the same dashboard, list instances of type "ProcessAvailabilityEntry", filter for the process name under review (E.g. cmd.exe) and then search for "ProcessCount percent" to verify the values for expectedProcessCount, matchedProcessCount and percentAvailability.

Troubleshooting
- Go to Homes | Alarms | Acknowledge and clear the last received Process Rules
- Wait at least 5 minutes and let us know if the rules fires again (Provide exact Time)
- Go to Dashboards | Administration | Rules and Notifications | Rule Diagnostics | click on the process availability Rule | click Diagnostic Details | select desired process | grab a screenshot
- Please do the same for the Process Count and grab a screenshot. Also grab a screenshot of the main Rule Diagnostics dashboard filtering by Process.
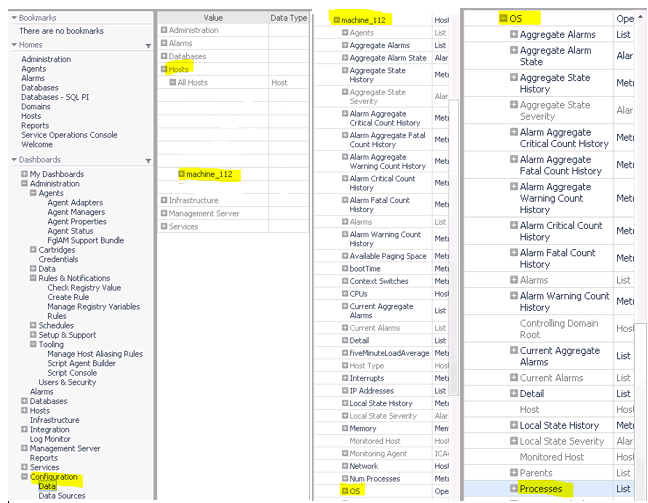
- Have a look at the raw data under Configuration -> Data -> Hosts -> -> OS -> Processes -> -> "instance count" to determine how many instances are found on the monitored host. Also, check percentAvailability under each process listed in Process Availability config. If percentAvailability < 90%, the alarm should be observed for that process.

Note:
The processes that never run on the target server may not be shown under the /Data/Host/OS/Process even they are defined in the agent properties. You should check with Script Console dashboard for this kind of processes.
Q&A
- How to reduce the delay time since the process stops until the alarms is triggered.
=> Shorten the collect interval.
- Why we only receive the alert once, we must have to ack and cleared. Is this the only way?
=> The rule will evaluate the data it concerns periodically. If the condition is met, depending on whether there is an existing alarm that is not yet cleared or acked, it will either fire a new alarm or update the properties of the existing alarm. FMS will only send the email for new alarms. This is because if it sends whenever the alarm gets updated, you will probably get an alarm storm, if you cannot address the problem immediately (weekend, mid-night), which is annoying and most people don't want to have.
- In case you modified some settings: "Data collection scheduler" under Agent Properties: Entered default collection every 30 seconds [14:00] What would this cause? Is this value acceptable?
=> Setting interval below 1 minute is not recommended, as it may put too much pressure on target server and agent will skip some collect cycle if the collection is taking more than 1 minutes.
When you stop the process you only received one alarm but the e-mail does not match none of the Process_Availability mail.message
If you want to know how the is #percentAvailability# is calculated to try to make the fatal, critical or warning to trigger.
If under "Process availability config" you specify 1 instances then you must understand that if you stop that process, you would be receiving the fatal alarm and the corresponding e-mail. However the e-mail does not match and you are not sure if the received e-mail corresponds to the Process_Availability or the Process_Exist_Count.


