-
Title
Introduction to the Global View Databases dashboard -
Description
What information is available on the Global View databases dashboard -
Resolution
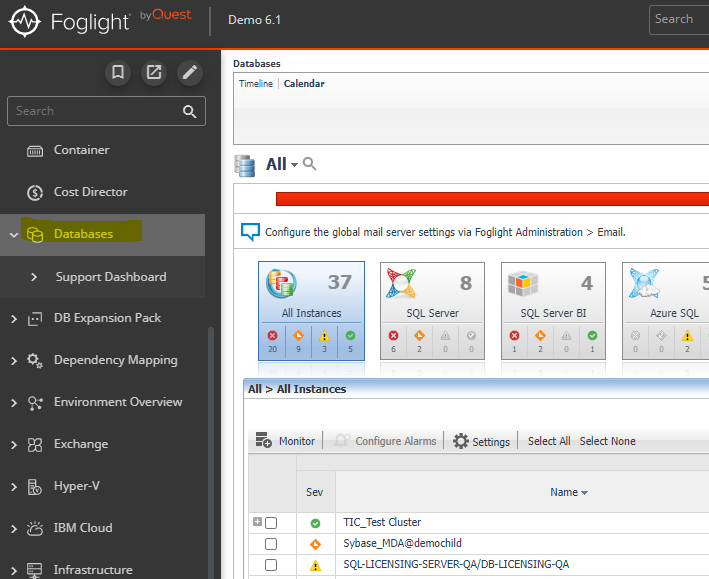
In Foglight 6.0 and higher the Global View databases dashboard is available here:
The Databases dashboard provides an at-a-glance view of the monitored environment, with all of the currently monitored database types.The Databases dashboard includes these sections:• Database cartridge type tiles — each tile represents a database type (SQL Server, SQL Server BI, Oracle, Sybase, DB2, MongoDB, Cassandra, or All Instances) and displays the number of instances for each database type, along with a breakdown according to the instance health state severity (Normal, Warning, Critical, Fatal).• Status section — includes the following components:
- Status summary — a color-coded bar, which provides a visual representation of the summarized health condition of all instances listed in the Database Group table. The status summary bar provides a graphic representation of the monitored environment’s current state, broken down to the number of instances and their current health state: Fatal, Critical, Warning, Normal or Unknown.
-
Database-specific health summary — when the database group All is selected, this section displays all of the currently monitored instances for each database type, divided by their health state (for example: four Oracle instances, three of which have the health state Warning and one is indicated with the health state Fatal). When a user-defined database group is selected, this section displays data only about the agents included within the selected group.
• The Monitor button — Use this button to add instances to be monitored.
• The Configure Alarms button — Takes you directly to the Administration | Alarms page. On the Alarms page you can configure alarm settings and specify alarm sensitivity levels. Sensitivity levels control which alarms are enabled by default.
• The Settings button — Use this button to do one of the following:• Access the User Management settings, allowing you to restrict which instances specific users are allowed to view. This makes it easier to for users to find information about only the instances they are interested in. For details, see Assigning Instances to Users .• After selecting one or more instances of the same database type, use this button to set options for collecting, storing, and displaying data for the selected instances, as well as configuring the connection to SQL Performance Investigator (if installed).• Currently selected database group table — a list of all monitored databases within the database group that is currently selected in the Databases section.• The Show Quick View button — provides the ability to open a quick view of the instance at the bottom of the screen.• The Select dashboards () button — provides direct link to several drilldowns and panels, thereby saving the need to navigate to these locations through the Overview drilldown.
IMPORTANT: If the display is filtered to show only Oracle or SQL Server instances, the Databases table is renamed, and a one or more new tabs are shown.
The following video provides details on the Database cartridges common Globalview databases dashboard:

