
Introducing Foglight APM
Monitoring Transactions
Investigating real user APM transactions
Investigating application server transactions
Configuring display options
Examining Response Times
Investigating response time breakdowns
Configuring Response Time Breakdown settings
Additional configuration options
Examining Error Breakdowns
Viewing Real User Activity from a Geographical Perspective
Using the SOC Transactions Tab
Exploring the SOC Transactions tab
Exploring response time breakdowns from the SOC
Configuring display options
Using the SOC for APM triage
Creating Custom Drag-and-Drop Dashboards
APM Tile and View Reference
Overview of APM tiles
Application Servers - .NET tile
Application Servers - Java tile
DB2 tile
Host tile
JMX tile
MQ tile
Oracle tile
OS tiles
Pivot tiles
Real User (APM) tile
Real User (FxM) tile
Sequence tile
SQL Server tile
Sybase tile
Synthetics tile
Virtual Hyper-V tile
VMware tile
Overview of Detail views
Application Server detail view
Host detail view
Pivot Breakdown detail view
Real User (APM) Performance detail view
Appendix: Enabling End User Transactions from FxM and FxV
Hits and Pages tabs
Response Time Breakdown tab
Application Infrastructure tab
Related Infrastructure tab
Real User (FxM) Performance detail view
Synthetic Result detail view
Synthetic User Performance detail view
Virtual Machine detail view
Topology object name reference table
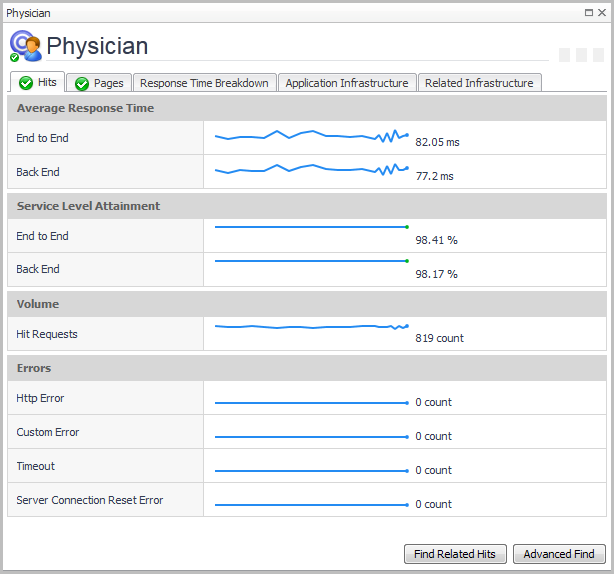
Hits and Pages tabs
Figure 84. Example of the Hits tab view
|
• |
Click Find Related Hits to open the Search Hits page. For information about searching hits, see the Foglight APM User Guide. |
|
• |
Click Advanced Find to open a list from which you can select a specific type of search. Choose from hits with: back end violations, end to end violations, or errors. The Hit Search runs with your selected criteria. Any results are returned on the Search Hits page. For information about searching hits, see the Foglight APM User Guide. |
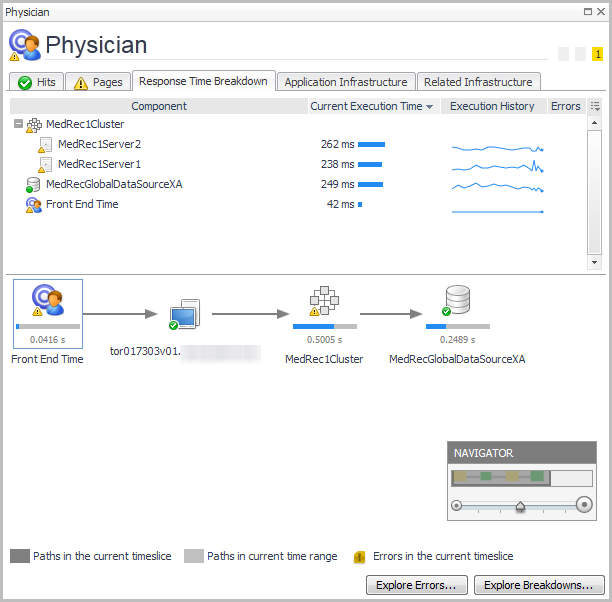
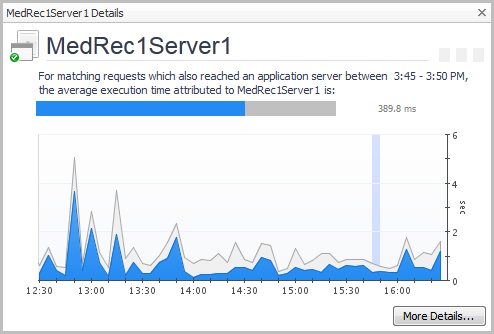
Response Time Breakdown tab
|
• |
|
• |
|
TIP: If you click a datasource component icon, the details view also includes a Map to Application Component button. For more information, see Mapping datasources. |
Click More Details to drill down to a detailed view of the selected application component. For example, from an application server component, you can access the Java™ application server details view.
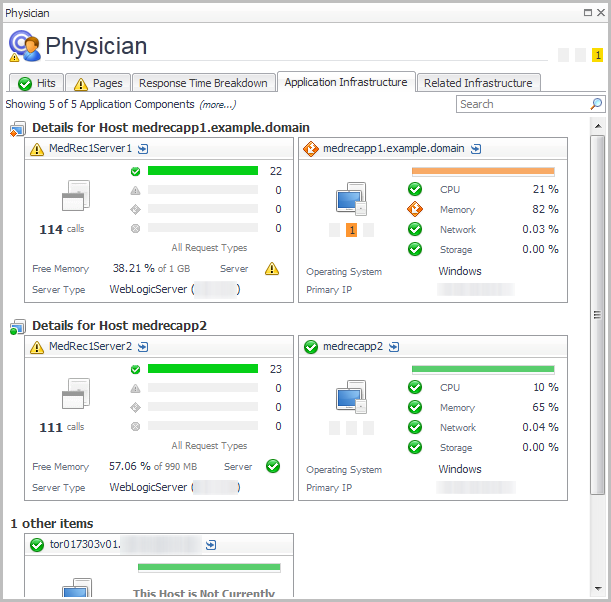
Application Infrastructure tab
|
• |
|
• |
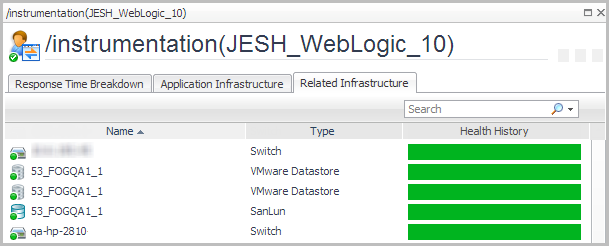
Related Infrastructure tab
The Related Infrastructure tab displays a list of related infrastructure components, such as NMS devices, virtual machines (VMs) and ESX® servers, and devices managed by Foglight™ for Storage Management.
|
|
||
|
|
VMware® Datastore |
|
|
|