.NET tile
Use the .NET tile to gather performance information about the state of .NET® transactions monitored by Foglight for Microsoft .NET, version 5.6.x or earlier.
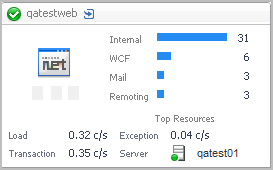
Topology Object Name: NETApplicationInstance
This tile displays the current top used external resources from the list below.
Application Servers - Java tile
The Application Servers - Java Tile summarizes the performance of a Java EE system monitored by Foglight for Java EE Technologies. Use this tile to gather performance information about the state of Java™ transactions.
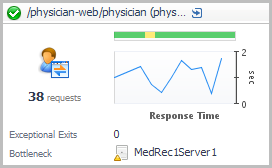
Topology Object Name: CustomApplicationTransaction
If the application server includes Request Types in the selected time range and the server has served at least one request in the selected time range, you can click the title bar to drill down to the Application Server detail view. If there are no request types, clicking the title bar drills down to the server details.
|
|
|
• |
Hits. The number of calls served in the most recent collection interval. | |
|
|
|
• |
Health History Bar. The color-coded bar represents the alarm state of the monitored component over the time range selected in the SOC. The color of the bar changes depending on the alarm state. Red indicates a Fatal state, orange indicates Critical, yellow means Warning, and green is the Normal state. | |
|
|
|
|
|
|
|
|
|
• |
Bottleneck. Indicates the portion of the application where requests are experiencing slowdowns. | |
DB2 tile
Use the DB2 tile to gather performance information about the state of DB2 transactions monitored by Foglight for DB2 LUW.
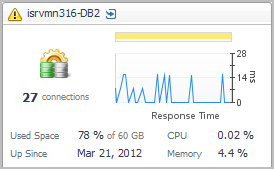
Topology Object Name: DB2_Instance
|
|
|
|
|
|
• |
Health History Bar. The color-coded bar represents the alarm state of the monitored component over the time range selected in the SOC. The color of the bar changes depending on the alarm state. Red indicates a Fatal state, orange indicates Critical, yellow means Warning, and green is the Normal state. | |
|
|
|
|
|
|
• |
Used Space. The average amount of database space used, as a percentage of the total space available. | |
|
|
|
• |
Up Since. The date the database was last restarted. | |
|
|
|
• |
CPU. The average CPU usage for all DB2 agents. | |
|
|
|
• |
Memory. The average memory usage for all DB2 agents. | |
Host tile
The Host Tile summarizes the performance of a host system monitored by Foglight for Infrastructure. Use this tile to gather performance information about the state of host transactions.
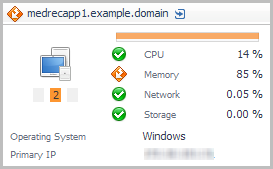
You can click the title bar to drill down to the Host detail view.
Topology Object Name: Host
|
|
|
• |
Alarms. A count of fatal, critical, and warning alarms on the host system. | |
|
|
|
• |
CPU. An icon representing the health state of the CPU, and the CPU utilization expressed as a percentage of the total available. | |
|
|
|
• |
Memory. An icon representing the health state of the memory, and the memory utilization expressed as a percentage of the total available. | |
|
|
|
• |
Network. An icon representing the health state of the network transactions, and the network utilization expressed as a percentage of the total available. | |
|
|
|
• |
Storage. An icon representing the health state of the storage (disk space), and the disk utilization expressed as a percentage of the total available. | |
|
|
|
|
|
|
• |
Primary IP. The primary IP address for the host system. | |
