Chatee ahora con Soporte
Chat con el soporte

Foglight for Application Operations 5.9.8.5 - User Guide

Introducing Foglight APM Monitoring Transactions Examining Response Times Examining Error Breakdowns Viewing Real User Activity from a Geographical Perspective Using the SOC Transactions Tab Using the SOC for APM triage Creating Custom Drag-and-Drop Dashboards APM Tile and View Reference Appendix: Enabling End User Transactions from FxM and FxV

Multi-Location Synthetics layout

The Multi-Location Synthetics tile shows summarized data about a synthetic transaction executed from multiple locations. This type of layout shows the total number of script execution locations and the numbers of locations for each alarm state (Normal, Warning, Critical, and Fatal). For more information about the metrics appearing on this tile, see section Multi-Location Synthetics tile.

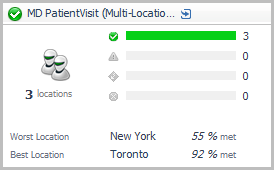
Drill down on this tile (click the title bar) to open the Synthetic User Performance detail view. For more information about the metrics appearing on this view, see section Synthetic User Performance detail view.

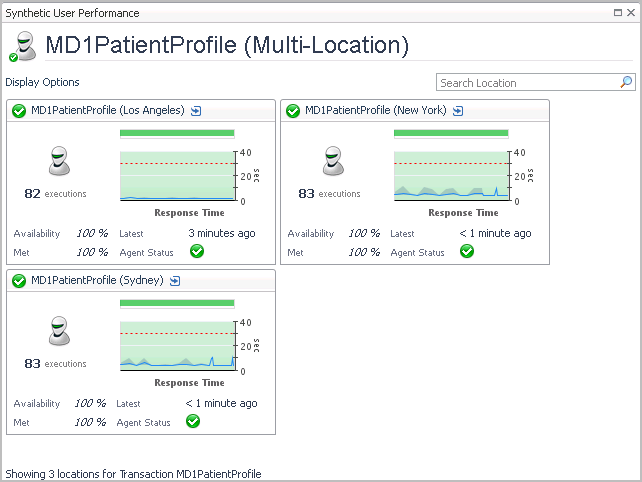
Drilling down on an individual location displays the Synthetic Result detail view. For more information about the metrics appearing on this view, see section Synthetic Result detail view.

Exploring response time breakdowns from the SOC

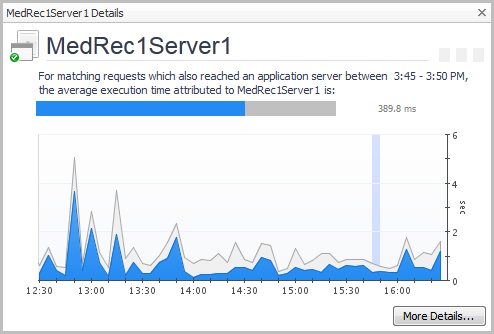
The Response Time Breakdown tab of the Real User (FxM) Performance detail view provides a summary of response time breakdowns for a selected transaction group.

2
Click the Reponse Time Breakdown tab.

In this view you can quickly check the execution time for a request through the various components that are included in the transaction group.

For example, in the previous image, you can see that 181.9 ms were spent on MedRec1Server1, and only 79.9 ms were spent on MedRec1Server2. The breakdown information makes it clear that MedRec1Server1 is causing a bottleneck for requests.

From here you can:

Click Explore Breakdowns to open the Response Time Breakdown Explorer dashboard. For more information, see Examining Response Times.
TIP: If you click a datasource component icon, the chart also includes a Map to Application Component button. For more information, see Mapping datasources.
Click More Details to drill down to a detailed view of the selected application component. For example, from an application server component, you can access the Java application server details view.

Configuring display options

You can customize the layout of the Transactions tab by selecting the appropriate options in the Tile Display Options dialog box. Use these options to control the total number of tiles, the order in which they appear, and the rollup options for multiple FTR locations.


Using the SOC for APM triage

In order to support triage use cases, Foglight APM provides unique views that cover the intersection of transactions, application components, and infrastructure elements that define an application. The Service Operations Console is the primary dashboard for performing incident management workflows that terminate with a handoff to application, domain, or platform specialists.

A user with the application support role for their organization uses the SOC to visually assess the current state of one or more applications. If transactional issues are present, they examine the state of transactions supported by a particular application, and assess the impact on the user population. They then visualize and evaluate the state of supporting applications and infrastructure to isolate the probable source of the issue. Finally, they engage the appropriate specialist.

This section presents use cases that illustrate the types of issues you may encounter. Follow the walkthroughs for these use cases to gain a greater understanding of how Foglight simplifies the triage process. These walkthroughs demonstrate problems arising from the following sources:

Documentos relacionados

The document was helpful.

Seleccionar calificación

I easily found the information I needed.

Seleccionar calificación