|
• |
| |||
| |||
| |||
| |||
|
|
• |
| |||
| |||
|
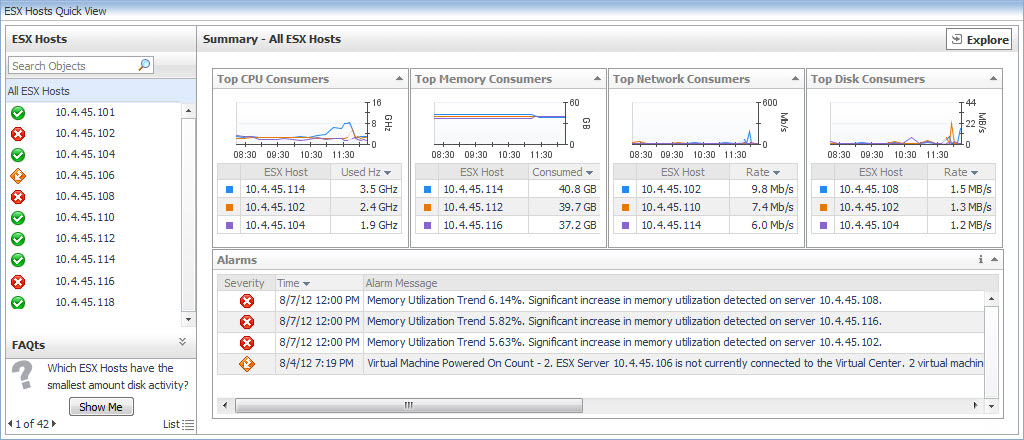
The Quick-View displays summary information about the objects you select from the Virtual Environment Overview, which is also available on the Virtual Environment Summary dashboard.
|
• |
On the VMware Environment dashboard, open the Monitoring tab. |
The Resource Pool Summary view shows the overall resource utilization and the amounts of system resource consumption for a physical resource pool.
|
1 |
On the VMware Environment dashboard, on the Monitoring tab, in the Virtual Environment Overview, select the Resource Pools tile. |
|
2 |
This view is made up of the following embedded views:
|
• |
|
Lists the alarms generated against the selected resource pool. | |||
| |||
| |||
| |||
Figure 322. Alarm dialog box
 |
| |||
| |||
| |||
| |||
| |||
Figure 323. Alarms dialog box
 | |||
Figure 324. Clusters Inventory dwell
| |||
Figure 325. Datacenters Inventory dwell
| |||
Figure 326. Resource Pools Inventory dwell
| |||
Figure 327. Virtual Centers Inventory dwell
| |||
Figure 328. Virtual Machines Inventory dwell
 |
|
Shows the resource consumption for the selected resource pool broken down into four simple views. | |||
| |||
| |||
| |||
| |||
| |||
| |||
| |||
| |||
| |||
| |||
| |||
| |||
| |||
| |||
Figure 329. CPU Load dialog box
 | |||
Figure 330. CPU Utilization dialog box
 | |||
Figure 331. Disk I/O dialog box
 | |||
Figure 332. Disk Utilization dialog box
 | |||
Figure 333. Memory Utilization dialog box
 | |||
Figure 334. Network I/O dialog box
 | |||
Figure 335. Network Utilization dialog box
 |