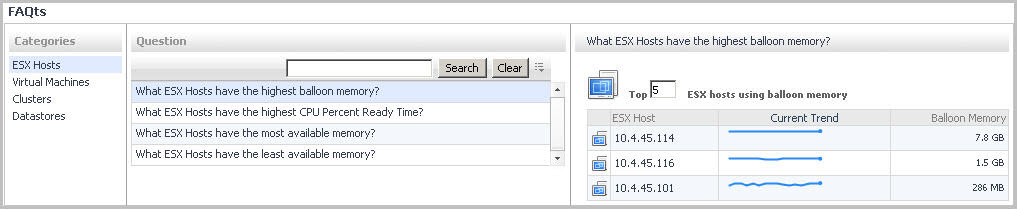
Through three embedded views (the Categories, Question, and Answer views), the FAQts tab enables you to ask Foglight for VMware questions and provides the answers to those questions.
The FAQts view appears on both the Virtual Environment Summary and VMware Explorer dashboards as a navigation tab.
The FAQts view is made up of the following embedded views:
|
• |
This view provides an answer to the question selected in the Questions view. The answer appears in the following form:
Top x <objects of category>…
where x is the number of objects of the category you provided in the Categories view.
Specify x by entering a number. The answer is relative to the subset of the infrastructure you are viewing in the dashboard. For example, the top 5 datastores are different for each individual cluster in the infrastructure.
This view lists the categories for which questions can be answered for you by Foglight for VMware.
Click a category in the list to select it.
This view lists the questions, for the category selected in the Categories, that can be answered for you by Foglight for VMware.
Click a question in the list to select it.
The VMware Explorer’s Memory tab displays the combined memory utilization for an ESX host, showing the amount memory used by each virtual machine that is running on that host. This includes the amount of active and shared memory in GB, all during a selected time period.
|
2 |
On the Virtual Infrastructure view, that appears on the navigation panel, select an ESX host instance. |
|
3 |
In the VMware Explorer, open the Memory tab. |
This view is made up of the following embedded views:
Figure 109. Active Memory graph
 |
Figure 110. Shared Memory graph
 |
|
Shows the list of all virtual machines that are running on the selected ESX host. By default, the Active Memory and Shared Memory graphs show the information about all virtual machines that exist in your environment. Selecting one or more virtual machines in this view and clicking Apply shows memory information for the selected virtual machines. This can help you quickly compare the statistics for two or more virtual machines, when needed. | |||
| |||
| |||
| |||
| |||
| |||
| |||
|
The VMware Explorer’s Monitor tab shows details of system resources consumption for a server or a virtual machine.
|
2 |
On the Virtual Infrastructure view, that appears on the navigation panel, select an ESX host or virtual machine instance. |
|
3 |
In the VMware Explorer, open the Monitor tab. |
This view is made up of the following embedded views:
|
• |
|
• |
|
Shows the details about the cluster to which the selected ESX host belongs. | |||
| |||
| |||
| |||
| |||
| |||
| |||
| |||
Figure 112. Alarms dialog box
 |
|
Shows the details about the datacenter the selected virtual machine is associated with. | |||
| |||
| |||
| |||
| |||
| |||
| |||
| |||
| |||
Figure 113. Alarms dialog box
 |
| |||
| |||
| |||
| |||
| |||
Figure 114. Alarms dialog box
| |||
Figure 115. CPU Utilization dialog box
 | |||
Figure 116. Disk Reads and Writes dialog box
 | |||
| |||
Figure 117. Memory Utilization dialog box
 | |||
Figure 118. Virtual Machines Inventory dwell
 |
| |||
| |||
| |||
| |||
| |||
| |||
| |||
| |||
| |||
| |||
| |||
| |||
| |||
| |||
| |||
| |||
| |||
| |||
| |||
| |||
| |||
| |||
| |||
| |||
| |||
| |||
| |||
| |||
| |||
| |||
| |||
| |||
| |||
| |||
| |||
Figure 119. Commands dialog box
 | |||
Figure 120. Composite CPU Utilization dialog box
 | |||
Figure 121. CPU N dialog box
 | |||
Figure 122. Data In dialog box
 | |||
Figure 123. Data Out dialog box
 | |||
Figure 124. ESX Host Memory Utilization dialog box
 | |||
Figure 125. Memory Granted and Consumed dialog box
 | |||
Figure 126. Heap Memory Consumption dialog box
 | |||
Figure 127. Kernel Memory dialog box
 | |||
Figure 128. Reserved Memory dialog box
 | |||
Figure 129. State Memory dialog box
 | |||
Figure 130. Swap File Used dialog box
 | |||
Figure 131. Unreserved Memory dialog box
 | |||
Figure 132. Zero Page Memory dialog box
 | |||
Figure 133. Host Memory Utilization dialog box
 | |||
Figure 134. Network Summary dialog box
 | |||
Figure 135. NIC Statistics dialog box
 | |||
Figure 136. Read Rate dialog box
 | |||
Figure 137. Disk Read Requests dialog box
 | |||
Figure 138. Storage Summary dialog box
 | |||
Figure 139. Network Packets Received dialog box
 | |||
Figure 140. Network Packets Sent dialog box
 | |||
Figure 141. Swap In dialog box
 | |||
Figure 142. Swap Out dialog box
 | |||
|
Figure 143. Writes. Displays the Disk Write Requests dialog box.
 | |||
Figure 144. Write Rate dialog box
 |
|
Shows the details about the resource the selected virtual machine is associated with. | |||
| |||
| |||
| |||
| |||
| |||
| |||
Figure 145. Alarms dialog box
|
|
Shows a list of virtual machines associated with the selected server. | |||
| |||
| |||
| |||
Figure 146. Alarms dialog box
 | |||
| |||
Figure 147. Virtual Machines Inventory dwell
|
|
Shows a list messages associated with the selected virtual machine. | |||
| |||
|
|
Shows the utilization of the selected virtual machine’s resources. | |||
| |||
| |||
| |||
| |||
| |||
| |||
| |||
| |||
| |||
| |||
| |||
| |||
| |||
| |||
| |||
| |||
| |||
| |||
| |||
| |||
| |||
| |||
| |||
| |||
| |||
| |||
| |||
| |||
| |||
| |||
Figure 148. Commands dialog box
| |||
Figure 149. CPU Utilization dialog box
 | |||
Figure 150. CPU N dialog box
 | |||
Figure 151. Data In dialog box
| |||
Figure 152. Data Out dialog box
| |||
Figure 153. Virtual Machine Memory Utilization dialog box
 | |||
Figure 154. Target and Actual Ballooned Memory dialog box
 | |||
Figure 155. Memory Granted and Consumed dialog box
 | |||
Figure 156. Target and Actual Swap Size dialog box
 | |||
Figure 157. Zero Page Memory dialog box
| |||
Figure 158. Virtual Machine Memory Utilization dialog box
 | |||
Figure 159. Network Summary dialog box
| |||
Figure 160. NIC Statistics dialog box
| |||
Figure 161. Network Packets Received dialog box
| |||
Figure 162. Network Packets Sent dialog box
| |||
Figure 163. Read Rate dialog box
| |||
Figure 164. Disk Read Requests dialog box
| |||
Figure 165. Storage Summary dialog box
| |||
Figure 166. Swap In dialog box
| |||
Figure 167. Swap Out dialog box
| |||
Figure 168. Write Rate dialog box
| |||
Figure 169. Disk Write Requests dialog box
|
This tab displays the utilization of the virtual switches associated with the selected ESX hosts.
|
2 |
On the Virtual Infrastructure view, that appears on the navigation panel, select a ESX host. |
|
3 |
In the VMware Explorer, open the Network tab. |
This tab is made up of the following embedded views:
|
For each virtual switch associated with the selected ESX host (and listed in Performance tab, Virtual Switches Connected to ESX Host), it displays the percentage of the network resources available to the switch that are in use. |
|
Identifies the virtual switches associated with the selected ESX host. | |||
| |||
| |||
| |||
| |||
| |||
| |||
|
|
Shows detailed configuration information about the selected virtual switch. | |||
| |||
| |||
| |||
| |||
| |||
| |||
| |||
| |||
| |||
| |||
| |||
| |||
| |||
| |||
Figure 171. List of network pools
| |||
Figure 172. List of port groups
| |||
Figure 173. Service Policies dialog box
 |
|
Displays detailed utilization information for the virtual switch selected in the Performance tab, Virtual Switches Connected to ESX Host view. | |||
| |||
| |||
| |||
| |||
|