View SQL Text (Inspect SGA)
This topic focuses on information that may be unfamiliar to you. It does not include all step and field descriptions.To view SQL text
- Select the Inspect SGA tab in the main window.
- Click
beside the Group list and select a group.
-
Select a job in the Job List pane.
-
Select a SQL statement in the SQL Statistics pane to display the SQL text.
Filter Columns
This topic focuses on information that may be unfamiliar to you. It does not include all step and field descriptions.To filter a column
| » | Click  to the right of the column header and select a filtering option. to the right of the column header and select a filtering option. |
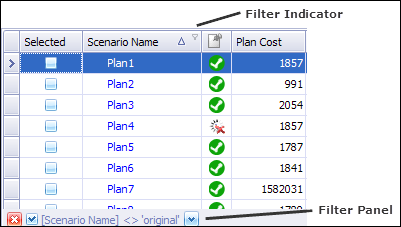
Note: When filtering is applied to columns,
displays to the right of the column header. A Filter panel also displays at the bottom of the grid that describes applied filters as illustrated in the following:
Tips:
-
Click
in the Filter panel to clear a filter or right-click a filtered column and select Clear Filter.
-
Click
in the Filter panel to enable or disable a filter.
-
Click
in the Filter panel to select a previously defined filter.
Use Execution Plans
About Execution Plans
The execution plan displays the steps a database takes to execute a SQL statement. You can use the execution plan to determine if a statement is efficient.
In the step formats (like Tree Plan) each step indicates how SQL Optimizer retrieves rows of data. The steps are numbered in the order of execution to make the plan easier to read.
Oracle executes each child operation before the parent operation. For some SQL statements, Oracle executes the parent operation once it retrieves a single row from the child operation. Other SQL statements require that Oracle retrieve all rows from the child operation before it executes the parent operation.
Reviewing Execution Plans
Use the Execution Plan window to review the execution plan for the original SQL statement or selected alternative. Several display options and configurations are available.
You can select an execution plan format, configure plan content, and customize plan text.
To select a plan format
- Right-click the execution plan and select View Plan | option.
- Select one of the following formats:
- Tree Plan—Displays plan as tree view with numbered steps.
- DBMS_XPlan (Formatted)—Displays plan using the DBMS_XPLAN output with added formatting.
- DBMS_XPlan (Plain Text)—Displays plan using the DBMS_XPlan output as plain text. This is the format returned by Oracle.
- Graphic Plan—Displays a graphic view of the plan. Includes numbered steps.
- MS Graphic Plan—Displays a graphic type view. Includes numbered steps.
- Plain Language Plan—Lists steps using descriptions in plain language.
- Go to Review Execution Plans to learn more about the different plan formats and how to customize them.
Execution Plan Window - Optimize SQL
The Execution Plan window displays the available execution plans. Each tab contains a different type of execution plan.
- Default Plan—The Default Plan tab displays the execution plan chosen by Oracle and is retrieved using the EXPLAIN PLAN statement. Click
to retrieve the default plan after entering/importing the original SQL.
-
Actual Plan—The Actual Plan is retrieved from the plan cache after execution and is the actual execution plan performed by the database to execute the statement.
- Virtual Plan—The Virtual Plan tab is displayed for indexes when you generate index alternatives in an Optimize SQL, SQL Rewrite session. See Fill Missing Execution Plans for more information about retrieving other execution plans for index alternatives.
Execution Plan Actions
Right-click in the Execution Plan window to select from the following actions:
|
Action |
Description |
|---|---|
|
Copies the execution plan to the clipboard. | |
|
Save |
Saves the execution plan as a .jpg file. The DBMS_XPlan formats can be saved as a .txt file also. |
|
|
Opens the print window so you can print the execution plan. |
|
Allows you to change how the execution plan is displayed. | |
| Step Description | Select this option to display a description of the selected step in the Execution Plan pane footer. |
| Plan Information |
If you select this option, SQL Optimizer identifies whether an execution plan uses any of the following: cardinality feedback, dynamic sampling, SQL plan directives, or adaptive plan. If applicable, the information displays in the Execution Plan pane directly above the Execution Plan tab. |
|
Highlights, one-by-one, the execution plan steps. | |
|
Plan Options |
Opens the Execution Plan Options window so you can select which information is displayed in the execution plan and whether to display specific items as a column. |
|
Help on plan step |
Displays the help text for the currently selected step in the execution plan. |
|
Help on Execution Plan |
Opens online help for the Execution Plan window. |


