Chatee ahora con Soporte
Chat con el soporte

Foglight Evolve 6.3.0 - User Guide

Monitoring a Service

Once you subscribe to a service, you can drill down and view details about that service.

These sections describes workflows for monitoring the overall health of your critical services and investigating problems with them.

Drilling down into a service

When you drill down into a service by clicking for a particular service. The view that appears depends on whether or not your Administrator configured a custom view using the Service Builder. If your Administrator did not configure a custom drill-down, you see a Service Summary dialog box listing the outstanding alarms and links to a default service breakdown. In addition, it provides a link to edit the service using the Service Builder dashboard. If your Administrator chose a custom view, it appears in the drill-down dialog box.

Viewing Services Details page

View more details about your services by clicking at the bottom right corner of the service and a Service Details page for certain service will be open.

Service Level

A summary of the service level compliance, alarms, and availability. For more information, see Investigating Service Levels tab .

Dependencies

Two types of service dependencies are displayed:

This diagram shows the composition of your service and the state of each component it contains. Use it to quickly scan for the root cause of a problem reported on the service. For details, see Visualizing the dependencies among services .

Heatmap

Heatmap visualizes components by alarms.

In the Heatmap, the size of the block is determined by the numbers of current alarms related to the component, and the color is determined by the highest severity level of the alarms related to the component.

Current Alarms

A list of uncleared alarms fired for components included in the selected service. See Viewing, Acknowledging, and Clearing Alarms for information about working with alarms.

History Alarms

A list of alarms fired for components included in the selected service. The alarm count includes all filtered alarms fired on hosts that are part of the service. See Viewing, Acknowledging, and Clearing Alarms for information about working with alarms.

You monitor services because you have a specific business requirement to ensure the availability of these components. The icons in the Service Level Compliance column reflect the availability of your services. Use this column as a starting point for investigating how problems with your services affect their service levels.

Foglight automatically examines each service and establishes its availability and service level compliance. By default, a service is available if it does not have any fatal alarms.

In Foglight, a service’s state is based on the worst state of the components it includes. For example, a MyApplication service contains services for its Web servers, application servers, and databases. The databases service is in a fatal state because it has a fatal alarm and the other two are in a warning state. MyApplication is also in a fatal state and is listed as non-compliant with its Service Level Agreement (SLA).

For example, the Availability History sparkline displays dips that concern you. You want to investigate your service’s availability for a specific interval you are concerned about, so you click My Services > Explore on specific service > Service Levels tab to navigate to the Service Levels dashboard. You then zoom in on one of the availability graphs in this dashboard. See the online help for the Service Levels dashboard for more information about it.

Click the Dependencies tab to display a graphic representation of the hierarchy of services that the selected service comprises. Use the components state icons to trace the critical path of performance issues across a domain.

Use the depth control, in the upper right corner, to set the number of levels (1-3) in the diagram. The default setting is two levels.

The dots above the depth control determine the scale of the diagram.

By default, Foglight arranges the components in a tree diagram. You can also manually change the components’ layout to position them as you wish. When you move a component, Foglight clears the Auto Arrange check box. Select the Auto Arrange check box to return to the original layout.

Investigate a service’s alarms to get more details about the problems contributing to its non-normal state.


Monitoring Your Hosts

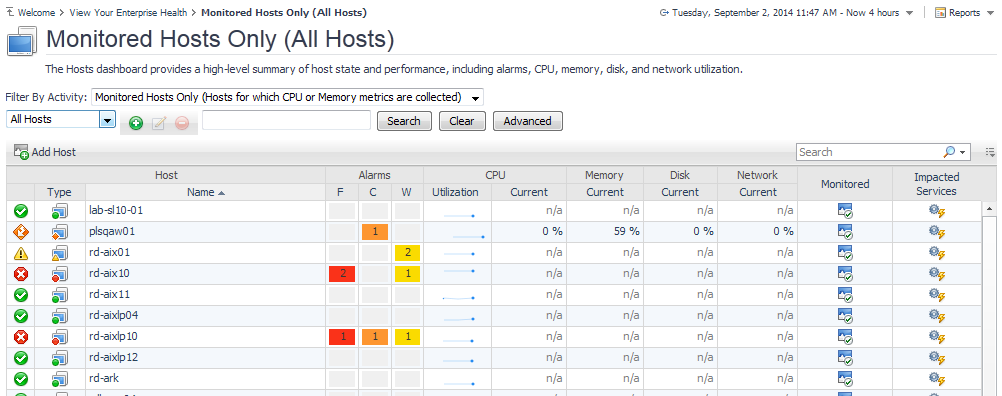
This chapter describes how to monitor hosts using workflows that start in the Hosts dashboard. By following these workflows, you can view the performance of all monitored hosts or drill down on a single host.

Use the Hosts dashboard to monitor for problems in your environment if you are responsible for the availability of a set of hosts and prefer to think in terms of systems. The Hosts dashboard provides the best high-level summary of host state and performance, including alarms, CPU, memory, disk, network utilization, if a host is being monitored, and impacted services.

Drill down from this dashboard to different dashboards and views that provide more detail about your hosts. You can also use this dashboard to see if a host’s state has an impact on services and view the health history of each host.

TIP: Visit http://eDocs.quest.com to watch our learning videos. See How to Use the Folflght Hosts Dashboard.
Documentos relacionados

The document was helpful.

Seleccionar calificación

I easily found the information I needed.

Seleccionar calificación