Related Objects views
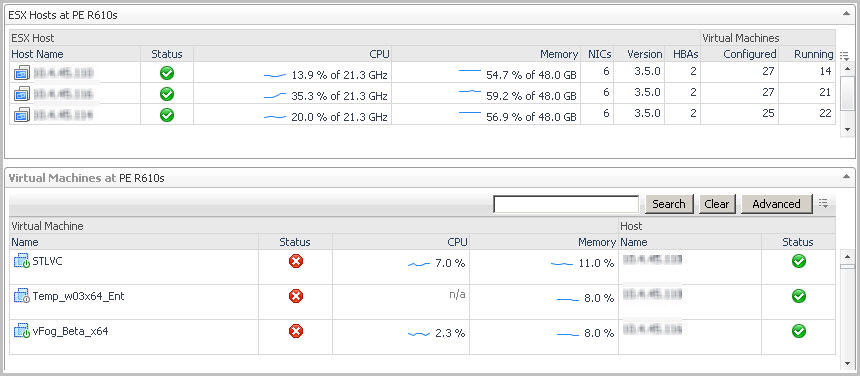
At least one Related Objects view is provided in the VMware Explorer dashboard.
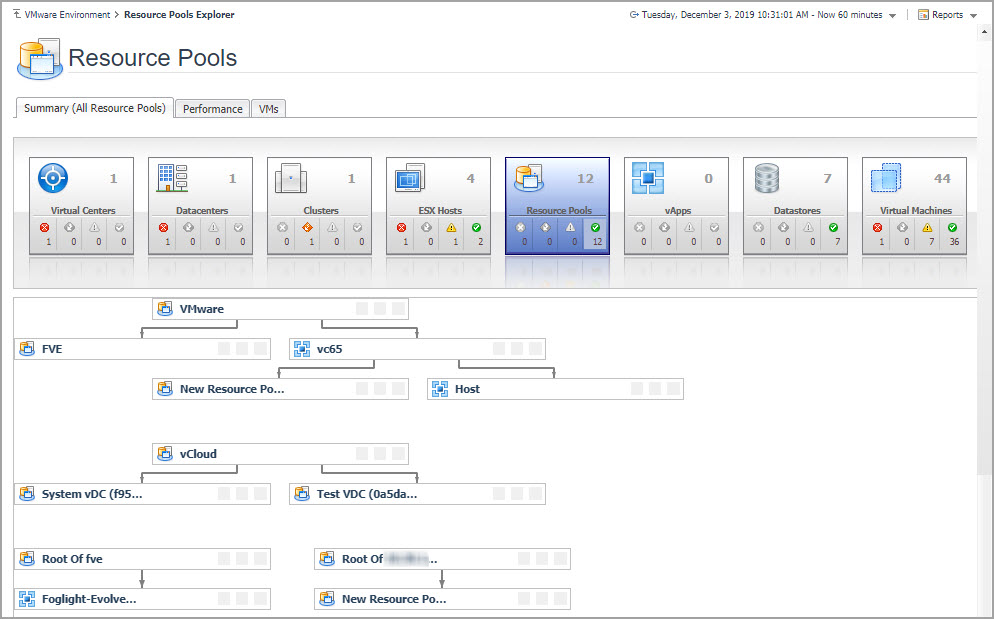
Resource Pools Relationship Tree view
For more information about the VMware Explorer dashboard, see Investigating performance metrics .
Shares tab
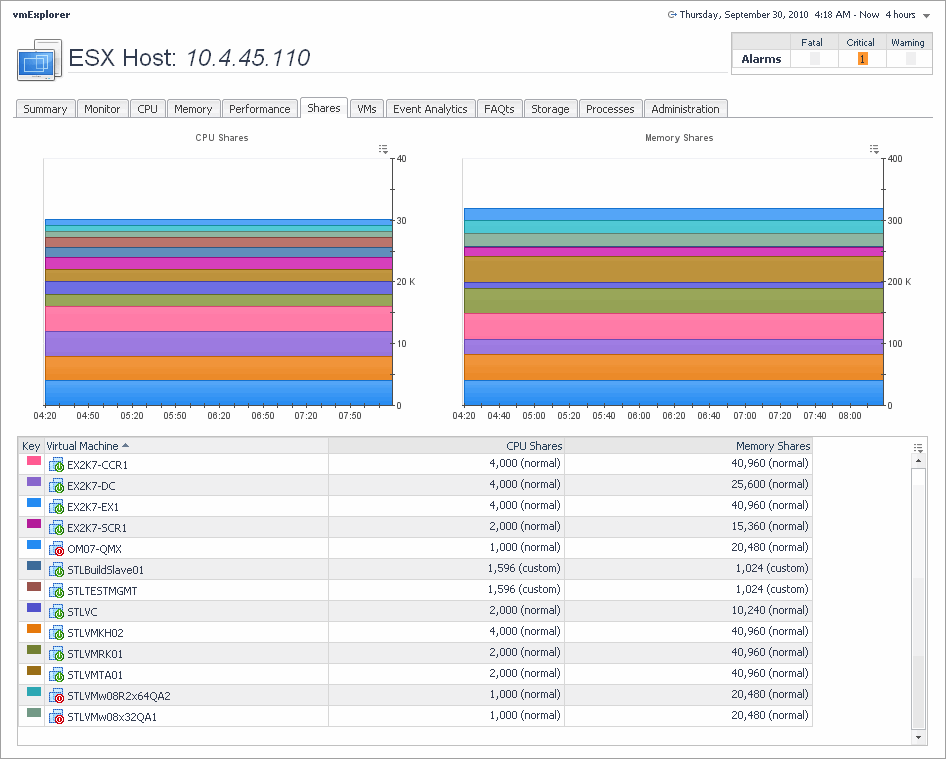
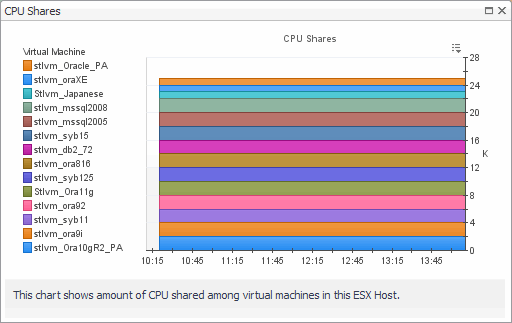
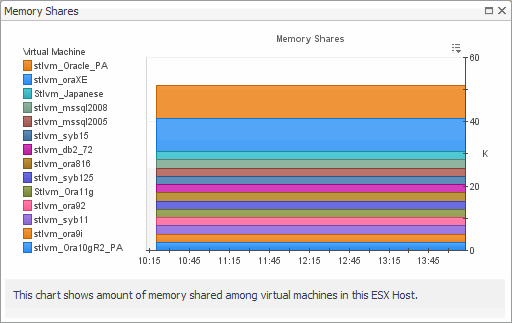
The VMware Explorer’s Shares tab displays the CPU and memory shares that are in use by the virtual machines associated with the selected component.
|
2 |
On the Virtual Infrastructure view, that appears on the navigation panel, select a cluster, ESX host, or resource pool instance. |
|
3 |
In the VMware Explorer, open the Shares tab. |
This view is made up of the following embedded views:
|
|
| |||
| |||
| |||
| |||
Storage tab (Cluster)
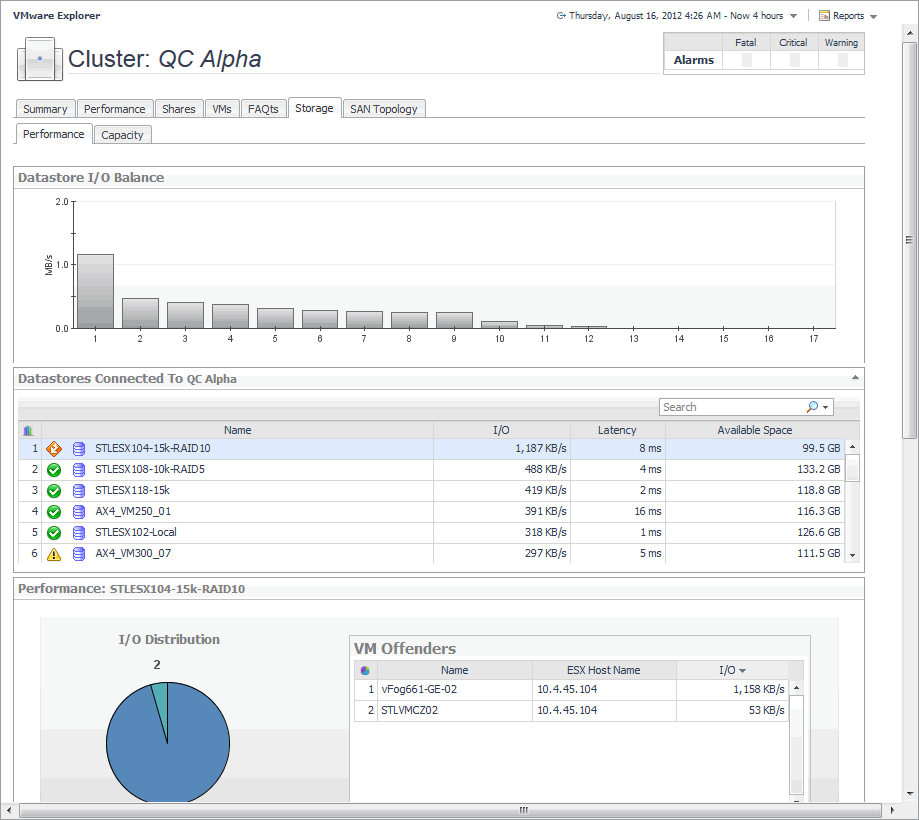
The VMware Explorer’s Storage tab displays the disk storage capacity associated with the selected component. Selecting a cluster and opening this tab displays the storage metrics associated with the selected cluster.
|
2 |
On the Virtual Infrastructure view, that appears on the navigation panel, select a cluster. |
|
3 |
In the VMware Explorer, open the Storage tab. |
This view is made up of the following embedded views:
|
This view contains information about the selected datastore data capacity. | |||
| |||
| |||
| |||
| |||
| |||
|
|
This view shows the datastore capacity for each datastore connected to the selected cluster. |
|
This view shows the data transfer rates for each datastore connected to the selected cluster. |
| |||
| |||
| |||
|
| |||
| |||
| |||
| |||
|
| |||
| |||
| |||
|

