CPU Usage tab
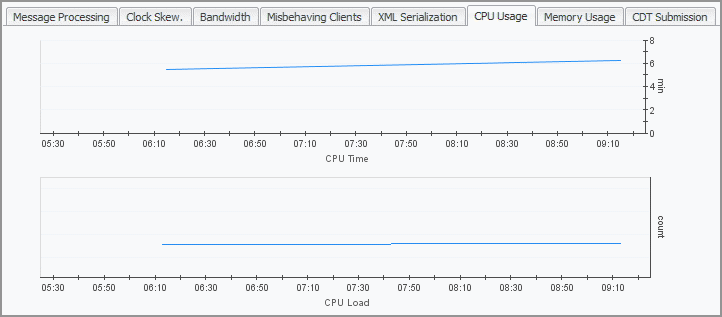
The CPU Usage tab displays the amount of time the CPU associated with a selected Agent Manager instance spends executing active processes and their number. For example, a sudden increase in CPU time may indicate that the user code is running inefficiently or a possible runaway process. Also, high CPU loads sometimes suggest that the host needs more CPU power to run efficiently.
Memory Usage tab
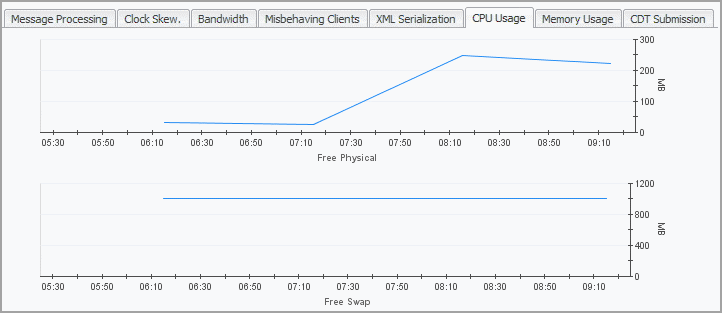
The Memory Usage tab displays the amount of available memory and swap space for a selected Agent Manager instance. For example, a shortage of swap space often suggests a memory shortage, while a decline in the available memory may indicate a memory leaking process.
CDT Submission tab
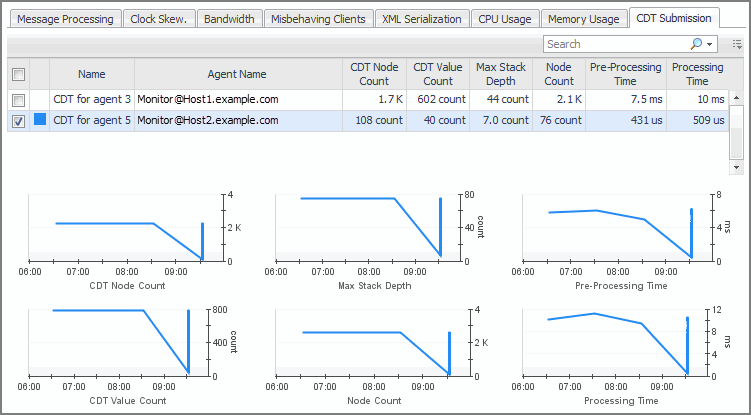
The CDT Submission tab displays information about the complexity of data that agents collect and submit for Canonical Data Transform (CDT) processing. Excessively large values or sudden increases in this data can result in performance problems.
The following metrics are displayed for each agent:
|
• |
CDT Node Count: The number of internal data nodes produced by the CDT. Typically, there is one node for each topology object and its metrics, and one global (root) node in the tree. |
|
• |
CDT Value Count: The number of metrics and/or observations produced by the CDT. |
|
• |
Max Stack Depth: The depth of the data tree structure submitted by each agent instance. When a topology object in the data submission refers to another topology object, that increases the depth by one. When the second object refers to a third, the depth is increased again. |
|
• |
Node Count: The number of nodes in the submission. It is a measure of how large the data submission is. |
|
• |
Pre-processing time: The Agent Manager makes two passes over the data submitted by an agent. This is the time spent on the first pass, when the Agent Manager fills in references, validates the submission, calculates missing timestamps, and performs other pre-processing tasks. |
|
• |
Processing time: The length of time it takes the Agent Manager to transfer the data submission to the CDT processing engine of the Management Server. |
Queue Utilization tab
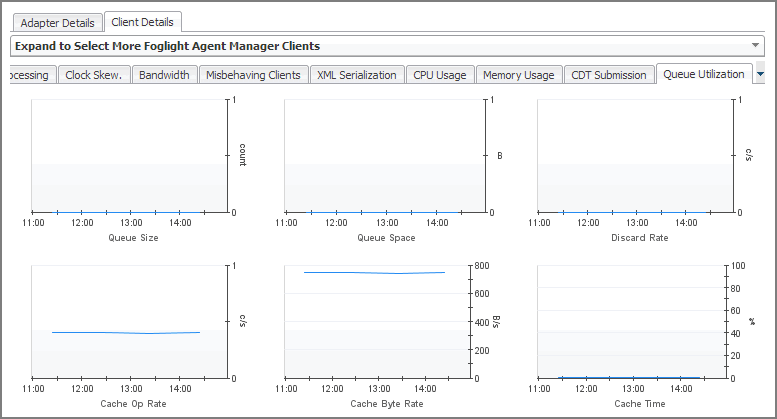
The Queue Utilization tab contains graphs that tell you how well the client queue and cache are performing. It displays the count of messages in the queue over time, its size, and the rate at which it discards messages. It also shows the rates of cache-related operations and memory consumption, and the percentage of time the client spends on cache-related operations.


