|
1 |
|
3 |
|
4 |
Leave the Name column unchanged. |
|
5 |
|
6 |
|
7 |
|
8 |
Leave the Name column empty. Ignore the warning when saving the component. |
|
9 |
Click Save in the top-left corner to save your work so far. |
|
1 |
Open the Monitored Hosts view for editing. |
|
2 |
Open the Flow tab. |
|
3 |
In the table left-most column, click Single-row Selection. |
|
4 |
|
5 |
|
6 |
|
7 |
|
8 |
|
9 |
|
10 |
|
11 |
|
12 |
|
13 |
Click Save in the top-left corner to save the changes made to Monitored Hosts. |
|
1 |
|
2 |
Click Add. |
|
3 |
|
4 |
|
5 |
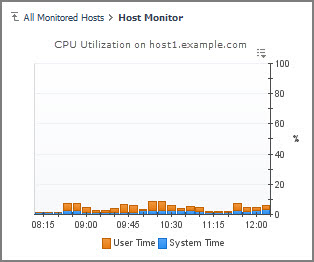
Choose Hosts > Host > [chart] CPU Utilization |
|
6 |
|
7 |
The next page of the Add View dialog box appears. It allows you to set properties for the view. |
|
8 |
Accept the default setting for the Width and Height properties by selecting these check boxes, along with Show Title and Show Border. |
|
9 |
|
10 |
Click Save in the top-left corner to save the changes made to the Host Monitor view. |
|
11 |
|
12 |
Click a row of the table to drill down to the Host Monitor view. |