Web Monitor Service Operation Console and Foglight for APM Transactions views
The Service Operations Console and Foglight for APM display the following Foglight Web Monitor views:
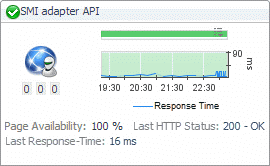
Transaction tile
The Network Device tile shows summarized information about the performance of a network device. The tile bar indicates the device name.

One or more transaction tiles appear in the display area.
|
|
|
• |
Alarms. The counts of Fatal, Critical, and Warning alarms. | |
|
|
|
• |
Health history bar. The color-coded bar represents the alarm state of the monitored application over the time range period selected in the Service Operations Console dashboard. The color of the bar changes over that period depending on the alarm state. Red indicates that the monitored application is in Fatal state, orange indicates Critical, yellow means Warning, and green is for the Normal State. | |
|
|
|
• |
Last HTTP Status. The most recent HTTP status code, indicating the result of the most recent transaction with the monitored Web site. | |
|
|
|
• |
Last Response-Time. The amount of time the Web Monitor Agent waited for a response from the monitored Web site during the most recent data collection attempt. | |
|
|
|
• |
Page Availability. The percentage of time the Web site was available when the Web Monitor Agent instances configured to monitor this Web site attempted to collect information. | |
|
|
|
• |
Response Time. The amount of time the Web site takes to respond to monitoring requests, over the selected time range. High values in the graph can indicate potential bottlenecks that likely need to be investigated. | |
|
|
|
|
|
Drill down on: |
|
|
|
Transaction dialog box
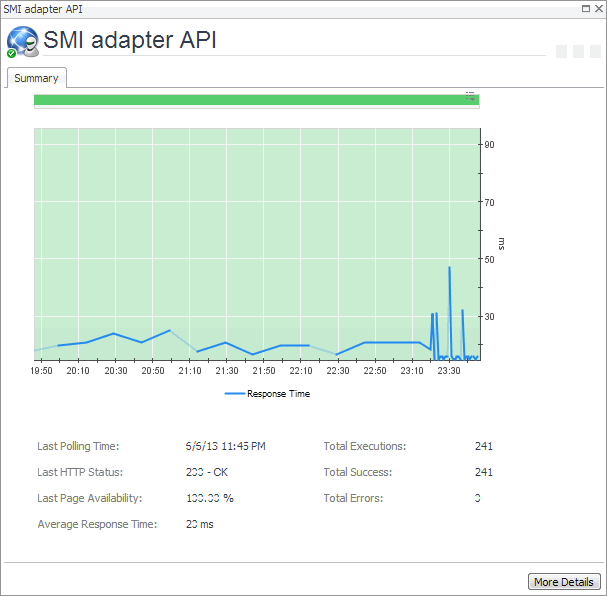
The transaction dialog box shows a series of charts displaying the response time statistics of the selected transactions, accompanied with additional performance indicators, such as the number of errors and the most recent HTTP status. This can give you a better idea of how the selected Web site is performing and alerts you about potential performance problems, if they exist. For example, high response times often suggests higher loads that may require further investigation.

|
|
|
• |
Alarms. The counts of Fatal, Critical, and Warning alarms. | |
|
|
|
• |
Average Response Time. The average amount of time all instances of the Web Monitor Agent configured to monitor this Web site wait for a response from the monitored Web site. | |
|
|
|
• |
Health history bar. The color-coded bar represents the alarm state of the monitored application over the time range period selected in the Service Operations Console dashboard. The color of the bar changes over that period depending on the alarm state. Red indicates that the monitored application is in Fatal state, orange indicates Critical, yellow means Warning, and green is for the Normal State. | |
|
|
|
• |
Last HTTP Status. The most recent HTTP status code, indicating the result of the most recent transaction with the monitored Web site. | |
|
|
|
• |
Last Page Availability. The percentage of time the Web site was available when the Web Monitor Agent attempted to collect information from it during the most recent data collection attempt. | |
|
|
|
|
|
|
• |
Response Time. The amount of time the Web site takes to respond to monitoring requests, over the selected time range. High values in the graph can indicate potential bottlenecks that likely need to be investigated. | |
|
|
|
|
|
|
• |
Total Errors. The total number of execution attempts that resulted in errors all instances of the Web Monitor Agent configured to monitor this Web site encountered during the selected time range. | |
|
|
|
• |
Total Executions. The total number of execution attempts all instances of the Web Monitor Agent configured to monitor this Web site performed during the selected time range. | |
|
|
|
• |
Total Success. The total number of execution attempts that resulted in success all instances of the Web Monitor Agent configured to monitor this Web site encountered during the selected time range. | |
|
|
Drill down on: |
|
|
|
Monitoring network devices
Foglight Net Monitor provides device availability and packet loss monitoring between monitoring locations and network devices. Use it to:
When you deploy Foglight Net Monitor, a set of predefined dashboards enables you to view the performance of the monitored network devices. This allows you to ensure consistent network device performance by re the collected statistics. Better management of your network devices can be achieved when you are alerted to potential problems before end users are affected.
Foglight Net Monitor relies on the Net Monitor Agent to collect data. The agent collects transaction information from monitored devices and visualizes the collected data in Foglight. You need to configure one agent instance on each monitored location.
Start by installing Foglight Net Monitor on the Management Server, deploying the Net Monitor Agent package, and creating agent instances on one or more hosts. For installation instructions, see the Foglight Infrastructure Utilities Release Notes.
Foglight Net Monitor uses the ICMP (Internet Control Message Protocol) service to monitor network devices. You need to configure this service to enable communication with network devices. For more information, see Configuring the ICMP service for monitoring.
As a next step, you can specify the devices that you want to monitor using the Devices Management dashboard. In addition to managing the collection of monitored network devices, this dashboard allows you to edit the data collection settings. For more information, see Managing monitored network devices.
Next, navigate to the Performance Browser. This dashboard displays the state of your system performance, providing a visual representation of the status of the monitored network devices and locations. Using this dashboard on a daily basis you can obtain an in-depth understanding of the state of your monitored network devices. Monitoring the same collection of network devices from different agent locations allows you to rule out any issues that may be related to host connectivity rather than device responsiveness. For more information, see Investigating the performance of network devices.
The Net Monitor Agent is equipped with a set of properties that affect its running state. You can make changes to them, as required. For more information about the Net Monitor Agent properties, see Configuring the agent properties.
For additional information, see the following topics: