Online-Only Topics
|
2 |
Select one of the Keep for options to indicate whether you want to keep the bookmark indefinitely or for a specified number of days. If you choose the latter, type the number of days in the box provided. |
|
3 |
Select Send an email with a link to this bookmark if you want to email someone a link to the new bookmark. |
|
4 |
Select Preserve state if you want to preserve the context input of the dashboard. For example, you bookmark a dashboard, and HostX is selected in a menu of that dashboard. When you view the bookmarked dashboard later, HostX is still selected. |
|
5 |
If you select Preserve state, the Preserve time range check box is available. Select this check box if you want to keep the bookmarked dashboard’s current start and end times. Otherwise, if the time range is relative (for example, Last 24 Hours), the bookmarked dashboard displays metrics for the default time period whenever you access it. |
|
6 |
Optional — Type a description for the bookmark. |
|
7 |
Click OK. |
|
8 |
If you selected the email option in Step 3 above, an email window opens, containing a link to the new bookmark. Provide the required information and click Send. |
Online-Only Topics
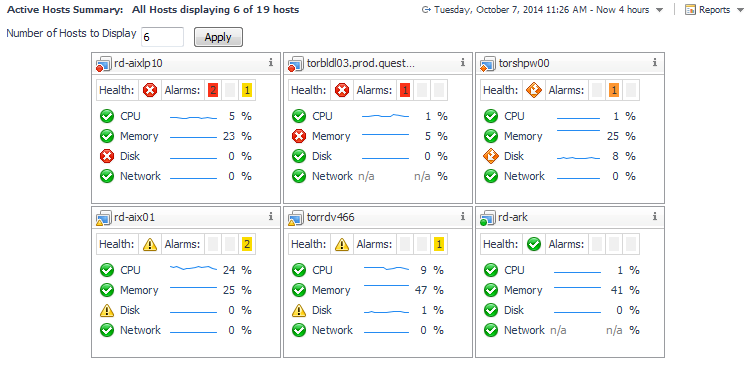
If you have a large number of hosts, you can use the Hosts dashboard, or use the Active Hosts Summary dashboard as a portlet in a custom dashboard and configure custom dashboards for each set of hosts. For information about creating custom dashboards using a selected dashboard, see Creating a Custom Dashboard Based on the Current Dashboard on page 82.
|
• |
|
1 |
On the Action panel, open the General tab, click Service Selector. |
|
2 |
Click the Filter Hosts By Service check box. |
Online-Only Topics
The name of the current host is at the top-left of the dashboard. To see data for another physical host, click Physical Host Selector in the action panel to open the Physical Host Selector dialog box, where you can choose another host.
Online-Only Topics
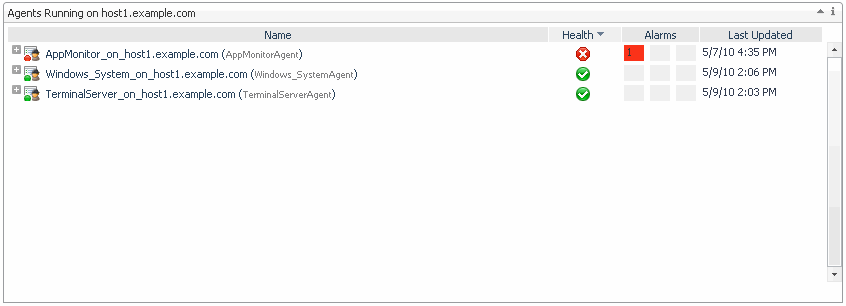
The Host Browser dashboard is similar to the Agents browser, except that it shows the agents for only one host at a time. It contains two views: Agents Running on <host> and Outstanding Alarm(s) for <host>.
The name of the current host is at the top-left of the dashboard. To see data for another physical host, click Physical Host Selector in the action panel to open the Physical Host Selector dialog, where you can choose another host.
The Outstanding Alarms view displayed at the bottom half of the dashboard is a common view in Quest Foglight. For information about working with alarms, see Viewing, Acknowledging, and Clearing Alarms.


