Chatee ahora con Soporte
Chat con el soporte

Foglight 5.9.8 - Web Component Tutorial

Using the Web Component Tutorial Tutorial 1: Drag and Drop Tutorial 2: Creating a Dashboard Tutorial 3: Adding a Drilldown Page Tutorial 4: Adding Views Tutorial 5: Using a Grid Tutorial 6: Reports Tutorial 7: Creating a Form Tutorial 8: Renderers Tutorial 9: Adding Questions and Answers Tutorial 10: Sending Messages to Other Users

Define a context input

1
With the Host Monitor view open for editing, open the Context tab.
3
In the new row, in the Key column, type host.
4
Leave the Name column unchanged.
5
Ensure the Usage column is set to Required.
6
Ensure the List column is set to False.
7
In the Data Type column, type Monitoring:Host.
8
Leave the Name column empty. Ignore the warning when saving the component.
Figure 5. Context Inputs
9
Click Save in the top-left corner to save your work so far.

Define a flow

The following steps direct the rows of the table to a view called Host Monitor and pass the required context.

1
Open the Monitored Hosts view for editing.
2
Open the Flow tab.
3
The Edit - Row Selection dialog box opens.
4
In the Edit - Row Selection dialog box, clear the Leave Unspecified check box.
5
Set Flow Type to Next Page.
6
Click the button on the right of the View box, choose Host Monitor.
7
Set View to Host Monitor.
8
Under Context Mappings, in the Selected Row box, type host.
The target page has a required input of host. Here, you are specifying that the selected row pass this key. The Host Monitor view does not show up in the list of available choices unless its required input is satisfied.
9
In the Edit - Single-row Selection dialog box, click Save.
The Edit - Single-row Selection dialog box closes and the Single-row Selection entry appears as a node, containing two sub-nodes: On Missing Inputs and On View Not Found. You can set a fallback view to provide an alternate if the drilldown page is not available.
10
Open the Configuration tab and select the Show Advanced Properties check box.
11
Under Selection Configuration, set Allow Reselection to true.
12
Open the Context tab and under Inputs, observe a newly added host entry.
13
Click Save in the top-left corner to save the changes made to Monitored Hosts.

Populate the dependent page

2
Click Add.
3
In the Add View dialog box that appears, choose Select existing view and click Next.
4
Ensure the Filter By: purpose and validity check boxes are selected.
5
Choose Hosts > Host > [chart] CPU Utilization
6
Expand Hosts > Host and choose [chart] CPU Utilization, and click Next.
We chose an existing page that displays useful data about a host rather than attempting to build such a complex page from scratch. Any page whose purpose is Page and accepts context inputs of timeRange and host can be used. A later tutorial demonstrates how such a page can be constructed.
7
The next page of the Add View dialog box appears. It allows you to set properties for the view.
8
Accept the default setting for the Width and Height properties by selecting these check boxes, along with Show Title and Show Border.
9
Click Finish to close the Add View dialog box.
10
Click Save in the top-left corner to save the changes made to the Host Monitor view.
11
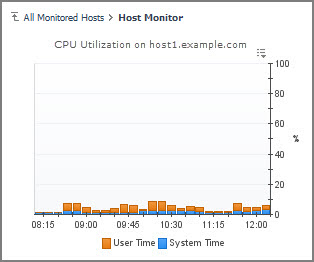
View the result by going to the Dashboards > My Definitions > All Hosts.

The figure shows a sample result. The CPU utilization for the selected host is displayed. Each different row selection in the table launches a view that presents data coming from the selected host. The overall construction of the view is always the same, but the data presented in the view comes from the chosen host.

Summary

In this tutorial you have been shown how to use a context input and a flow to present a drilldown page in which the data depends on the context that was passed to the dependent page.

Documentos relacionados

The document was helpful.

Seleccionar calificación

I easily found the information I needed.

Seleccionar calificación