Configuring monitoring agents
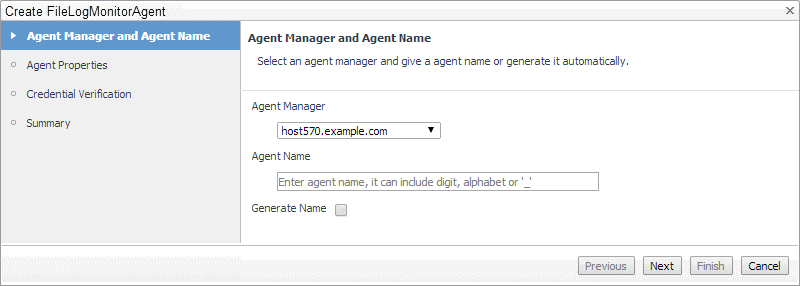
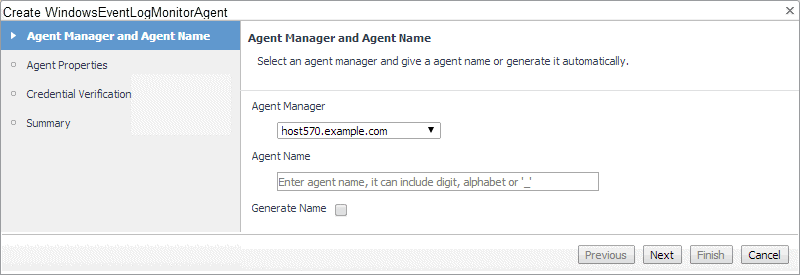
To create an agent instance, activate it, and start its data collection, use the appropriate wizard (Create FileLogMonitorAgent or Create WindowsEventLogMonitorAgent), accessible from the Log Monitor dashboard.
|
2 |
|
• |
To create a Quest File Log Monitor Agent instance, on the Log Monitor dashboard, in the top-right corner, click File Log Monitor to launch the Create FileLogMonitorAgent wizard. |
|
• |
To create a Quest Windows Event Log Monitor Agent instance, on the Log Monitor dashboard, in the top-right corner, click Windows Event Log Monitor to launch the Create WindowsEventLogMonitorAgent wizard. |
|
a |
On the Agent Manager and Agent Name page in the wizard, click Agent Manager, and from the list that appears, select a host running an Agent Manager instance that you want to use to manage the agent instance that you are about to create. |
|
b |
Specify the name you want to assign to this agent instance. In the Agent Name box, type the agent name. Optionally, select the Generate Name check box to have the wizard generate the name automatically. |
|
c |
Click Next. |
|
a |
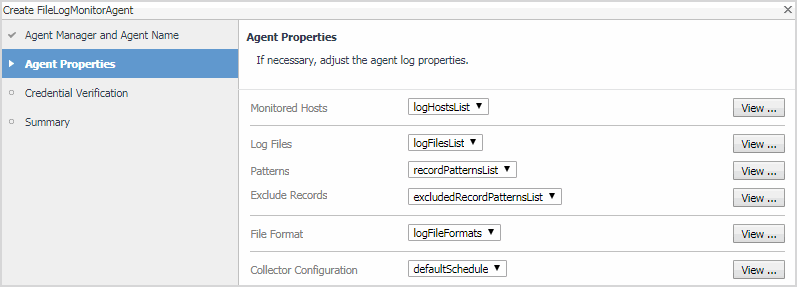
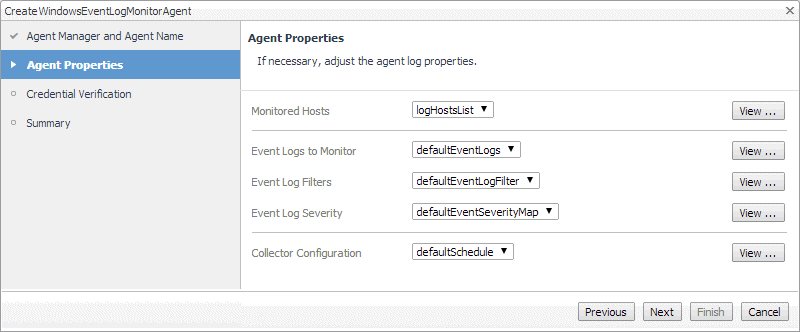
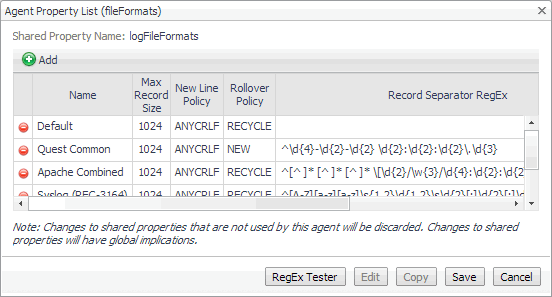
To view or edit a property, click View on the right of the list property name. |
|
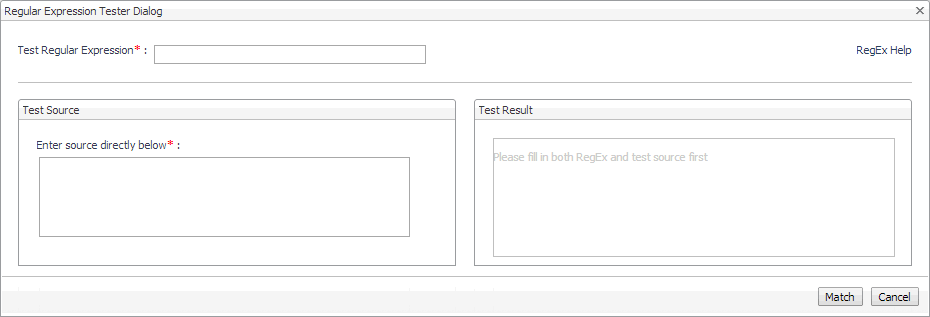
TIP: The agent supports PCRE (Perl Compatible Regular Expressions). For details about the PCRE syntax, visit http://perldoc.perl.org/perlre.html. |
|
c |
|
d |
|
5 |
Review the information on the Credential Verification page, and make any changes, if required. |
|
• |
If the page indicates that the Agent Manager does not have the credentials needed to access the monitored hosts, click Manage Credentials, and create a new credential, as required. For more information, see “Controlling System Access with Credentials” in the Administration and Configuration Help. |
|
6 |
Investigating log records
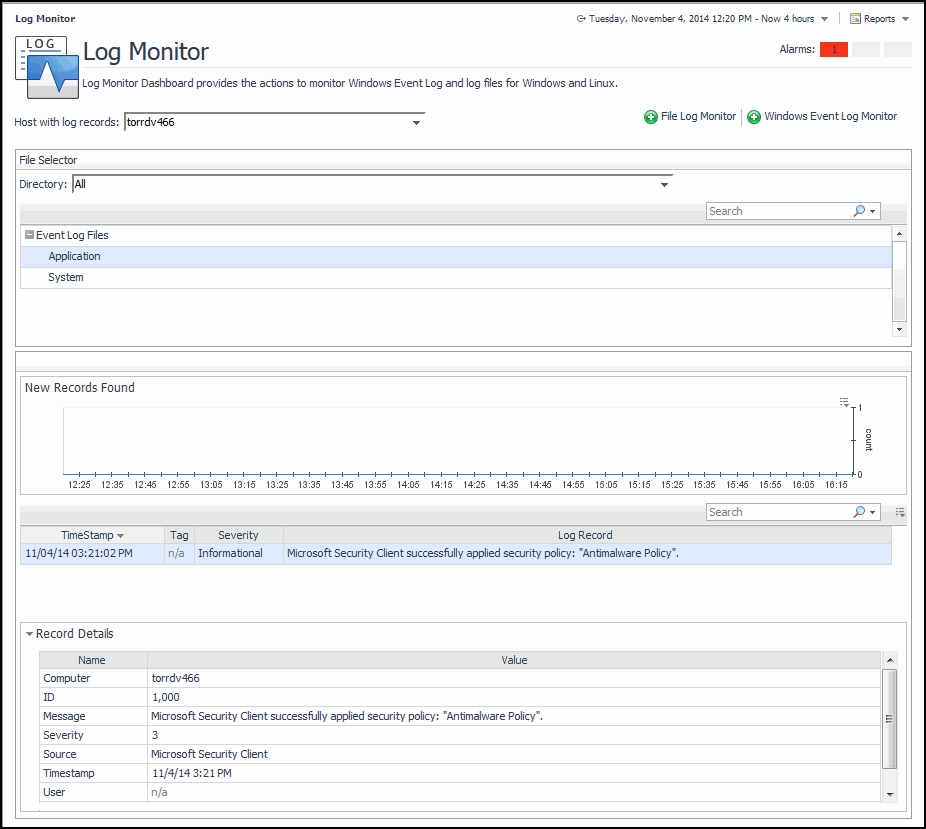
To access this dashboard, from the navigation panel, choose Dashboards > Log Monitor.
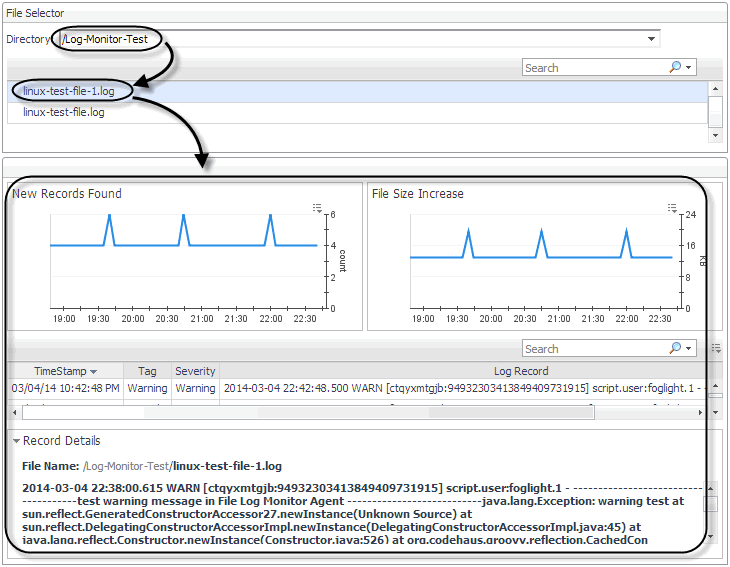
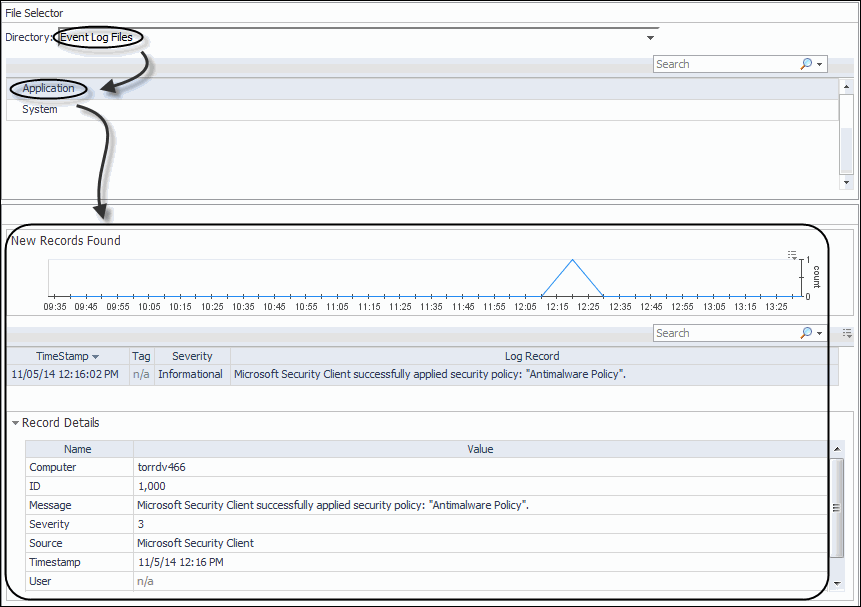
Start by choosing the host containing the log files whose records you want to review, using the File Selector view. From here, for file logs, you can select the directory and the log file name.
For Windows Event Logs, select Event Log Files, and choose the name of the Windows Event Log (for example, Application).
For complete information about the data appearing in these views, see Foglight Log Monitor views.
Configuring agent properties
The monitoring agents look for specific records given a text pattern in the monitored log files. They support regular expressions, which allows you to search for desired text patterns. The agents support PCRE (Perl Compatible Regular Expressions). For details about the PCRE syntax, visit http://perldoc.perl.org/perlre.html.
To monitor log records on a host, an agent establishes an SSH connection to Unix hosts, or a WMI or WinRM connection to Windows® hosts. Once this connection is in place, an agent executable is uploaded to the remote host (into %TEMP% on Windows and /tmp on UNIX®). The name of the executable name is unique to the agent instance. The executable then starts locating the monitored log files on the host and extracts the desired records, as specified in the agent properties. The agent sends back the extracted records to the agent for processing. The agent keeps track of the current location in all of the scanned log files so that the same information is only scanned once.
The monitoring agents use the same set of credentials as the other Foglight for Infrastructure agents, and the same credential purposes. For more information, see the Using Foglight for Infrastructure.
Default versions of these properties are installed with Foglight for Infrastructure, and configured for your agent instances when you run the configuration wizards. If you need to make changes to any list properties after configuring your monitoring agents, you can do so (see Configuring File Log Monitor agent properties and Configuring Windows Event Log Monitor agent properties). However, keep in mind that any changes you make to a list property can affect other agent instances. For more information about LogMonitor remote monitoring, see Configuring connections to remote Windows platforms.
For complete information about working with agent properties, see the Administration and Configuration Help.
|
a |
On the navigation panel, under Dashboards, select Administration > Agents > Agent Status. |
|
b |
Configuring File Log Monitor agent properties
For a configuration example, see FileLogMonitor configuration example.

