Exploring the FAQts tab
The FAQts tab available on the Performance Browser allows you to review frequently asked questions about your monitored systems and their answers. The Categories view shows several question categories. Selecting a category shows the questions belonging to that category in the Questions pane. From there, clicking a question shows the answer on the right.
For complete information about the data appearing on this tab, see FAQts tab.
Drilling down on transactions
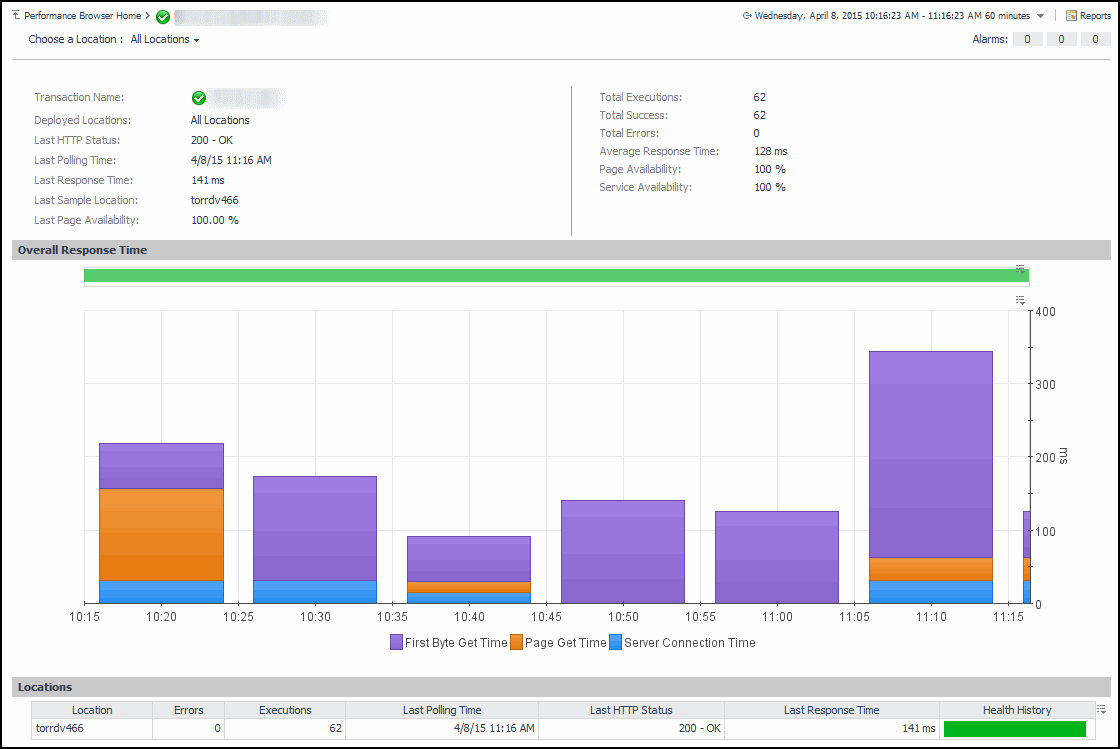
The All Locations drilldown view, displayed by default, allows you to review a larger set of metrics about the selected transaction, and to see how well that transaction is performing when monitored from different locations. Comparing the performance metrics collected from different locations can give you a general view of the responsiveness of your Web sites, and to indicate potential problems at locations that show response issues, and as such might require further investigation. For complete information about the data appearing on this view, see Transaction at All Locations drilldown view.
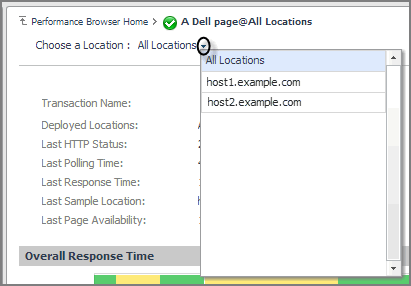
From here, you can drill down on a particular location and review its overall performance. To do that, click the down-facing arrow on the right of Choose a Location, and select a location from the list that appears.
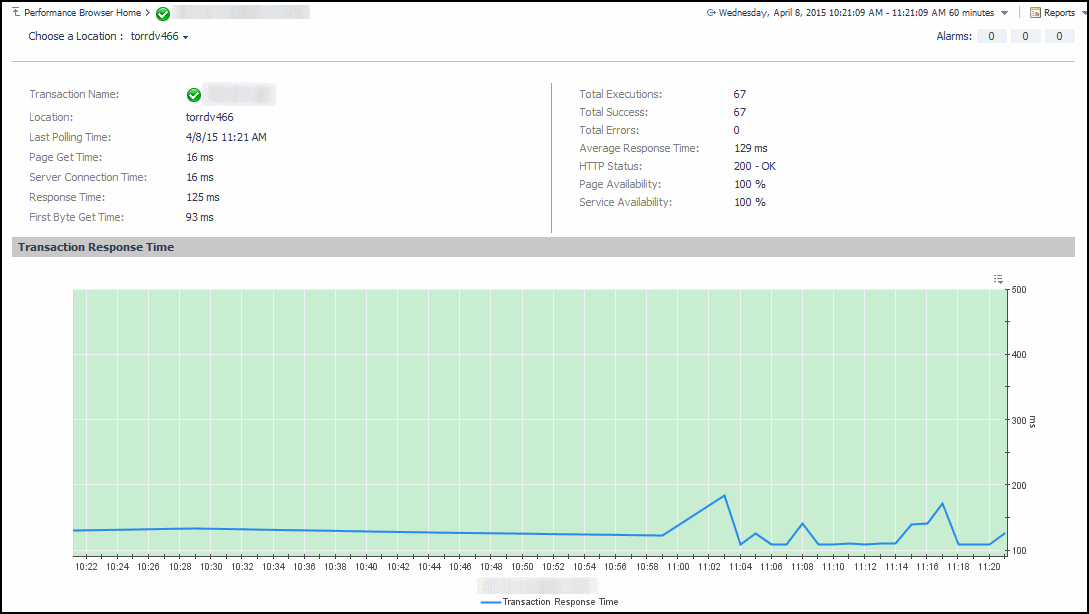
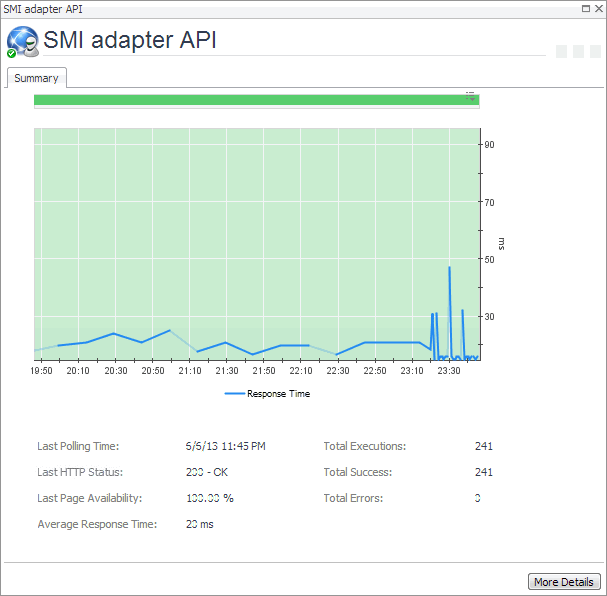
The top part of this view show a number of metrics resulted from monitoring that transaction from the selected location. The bottom part of this view shows a graph indicating the total transaction response times over the selected time range. High peaks in the graph often suggest potential bottlenecks and likely need to be investigated. For complete information about the data appearing on this view, see Transaction at a Selected Location drilldown view.
Drilling down on locations via the Locations tab
The Location drilldown view provides additional details about the selected location such as its response time and data collection metrics, and indicates its overall health during the monitored time range. For complete information about the data appearing on this view, see Location drilldown view.
Exploring Web Monitor services
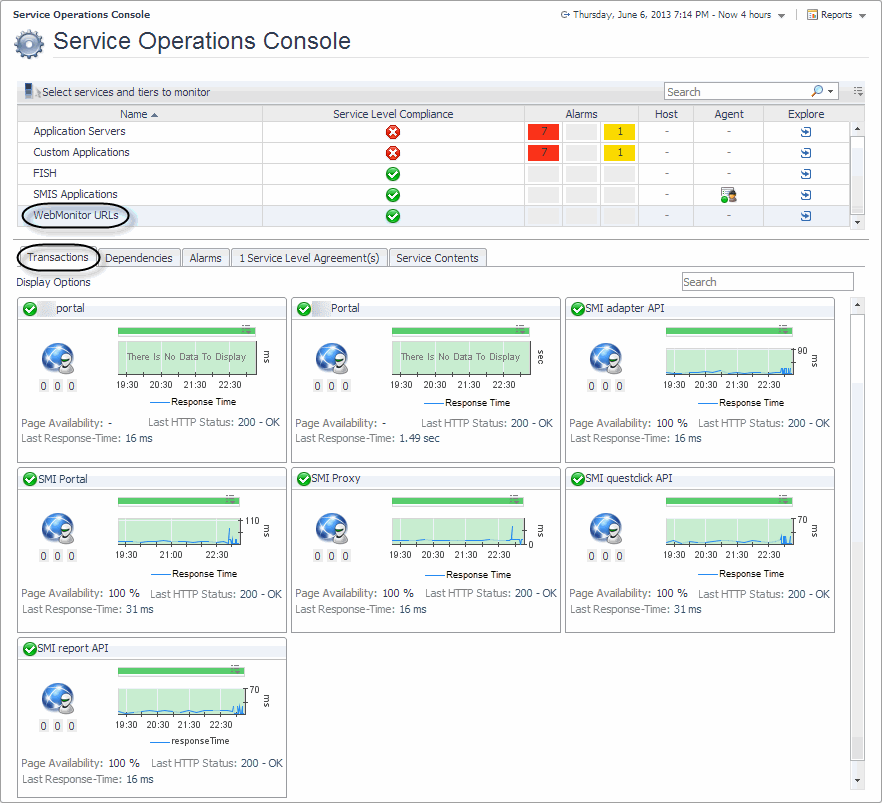
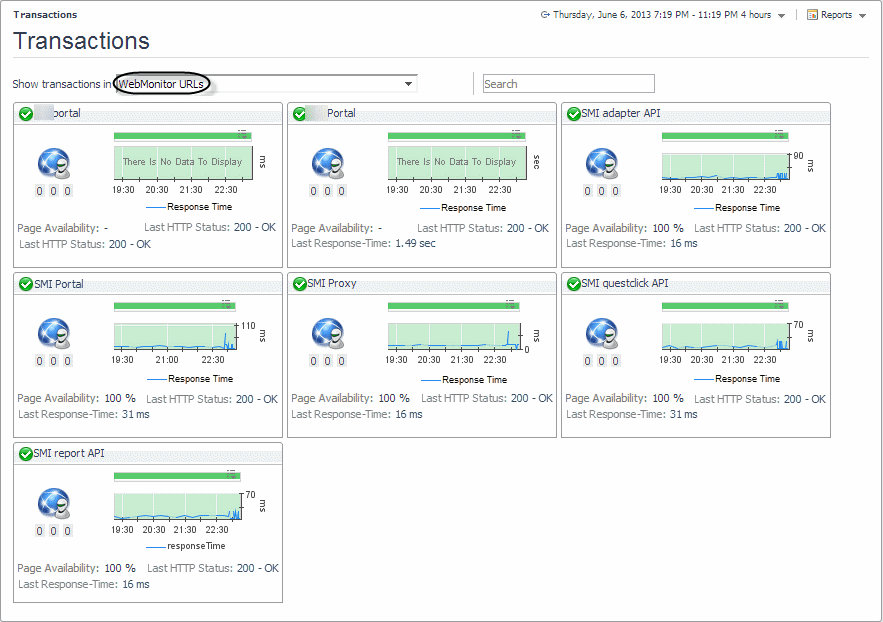
Foglight Web Monitor extends the Service Operations Console. When a Web Monitor service is defined and you also have Foglight for APM installed, you can visualize the Web Monitor transactions visualized in the Service Operations Console and on the Transactions dashboard, available with Foglight for APM. For more information about the Service Operations Console, see the Foglight User Guide. For details about Foglight for APM, see the Foglight Monitoring Application Performance User and Reference Guide.
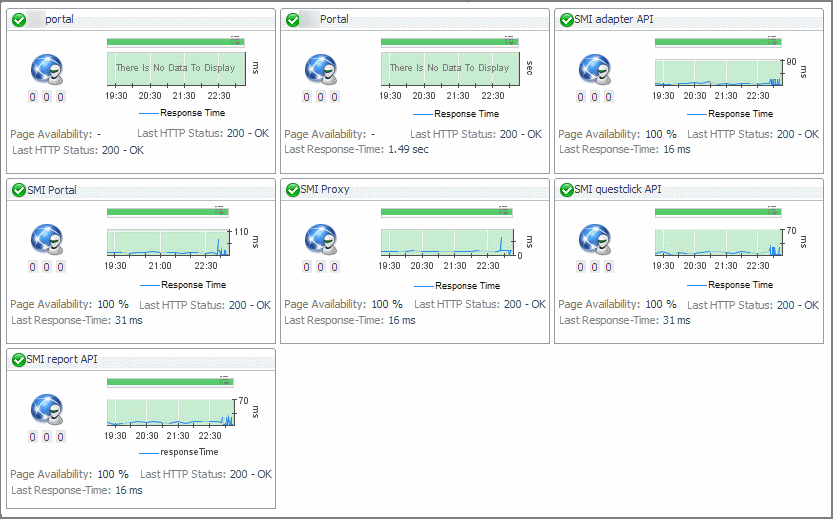
Start by navigating to the Service Operations Console dashboard and select a Web Monitor service. The Web Monitor tiles appear on the Transactions tab. The information displayed on these tiles helps you visualize how your Web transactions are performing, and to predict potential bottlenecks.
For more information about these views, see Web Monitor Service Operation Console and Foglight for APM Transactions views.
|
• |
On the navigation panel, click Services > Service Operations Console. |
|
• |
On the navigation panel, click APM > Transactions. |


