
Automatically identifty known distribution lists and mark them as such
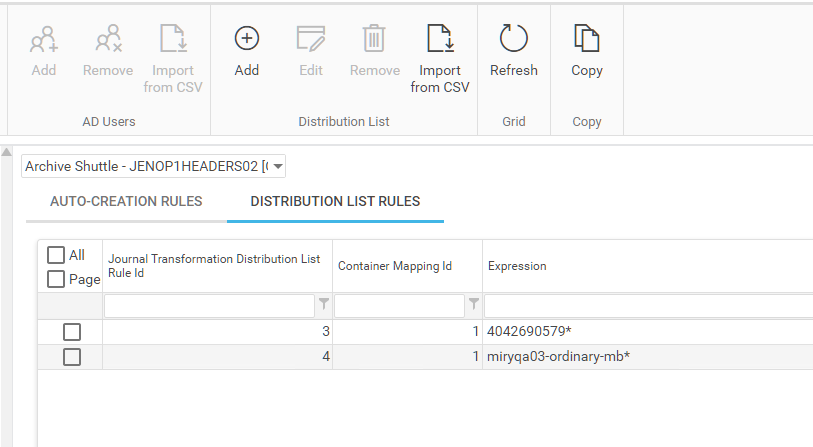
Under Journal Transformation, in the user interface, there is an option called Auto-creation Rules Management. This option allows an operator to create rules around email addresses to identify certain email addresses as distribution lists.
Operators can add a rule to automatically mark mailboxes matching the expression as distribution lists. Recipients are evaluated frequently and compared against a list of known distribution lists for their organization. When a match is made that recipient is marked as set as distribution list in the solution automatically.
Enable logging
In this article well discover information about log files and logging that can be performed by Archive Shuttle.
Logging Overview
All log files are centralised on the core server under the logging directory specified during installation.
It is rare to need to access module servers in order to review log files.
Logs are:
·Generated per module
·Roll over automatically (10 rollover files are kept)
·Default to info level reporting
Important Log Files
Several important log files include:
WEBUI.TXT
This is the log file for all user interface interactions
ArchiveShuttle.WebServicesLog.txt
This is the web services log file. It contains server side information about module to core communication. It can show which tasks or commands were queued and executed.
ArchiveShuttle.Service.Log.txt
This contains information about execution of database updates, and scheduled tasks.
Module core logs
These have a *.ModuleName.Core.txt suffix. They contain communication between the core and applicable module.
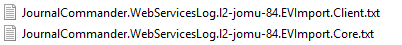
Module client logs
These have a *.ModuleName.Client.txt suffix.
|
|
NOTE: All log files from a specific machine include the machine name in the filename, for easy identification. |

Logging Levels
Module logging levels are controlled from the user interface. Go to Configuration > Modules > Select the desired module and choose the Set Log Level button. Changes take place almost instantly, there is no need for modules to be restarted.
Core logging level is set via System Configuration > General
Trace level logging is the most detailed.
Overview of a log file
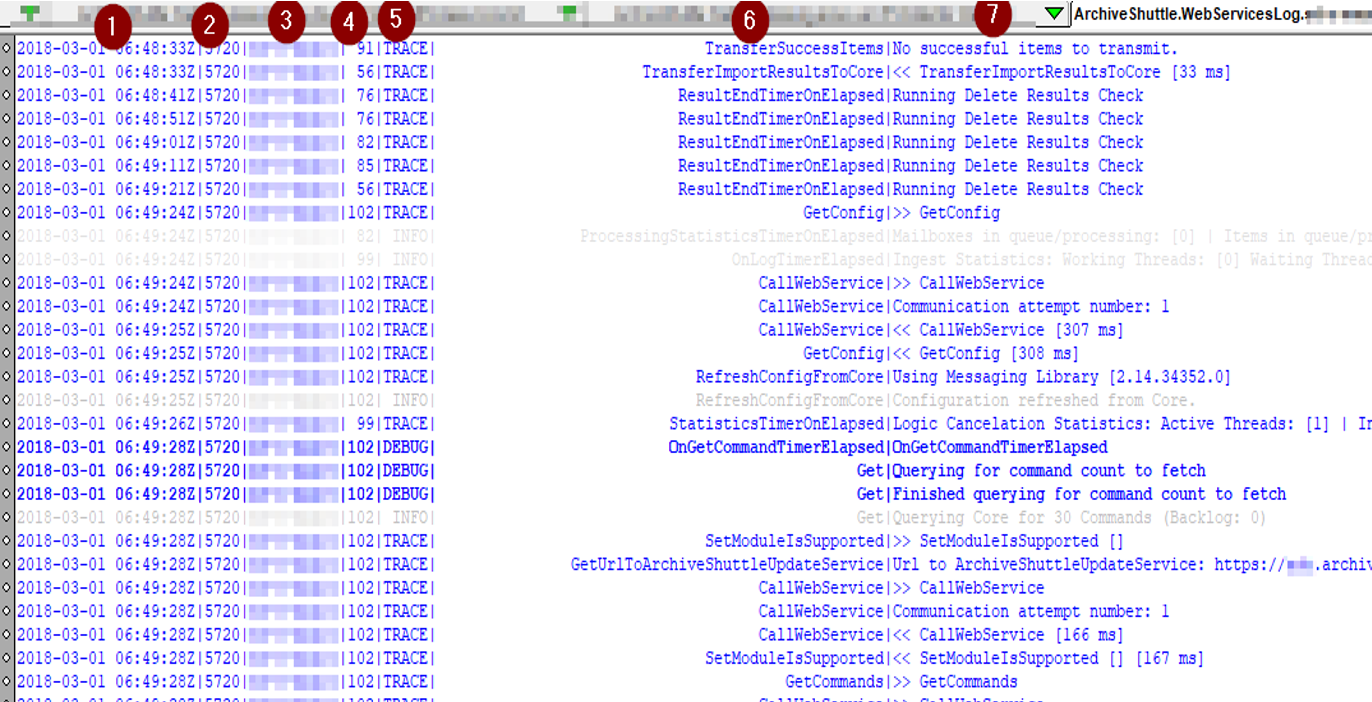
Key of terms
1.Date/time in UTC
2.Process ID
3.Hostname
4.Thread ID
5.Logging level
6.Function
7.Log entry
>> Implies the start of a request
<< Implies the completion of a request
Summary log file entries
Some log entries provide a summary of the modules current activity. This is often the visible report of a systems health.
Entries can contain a lot of information to aid in troubleshooting:
·Current performance
·Resource conumption
·Current processing statistics
·Summary of actions taken
·Duration of actions taken
Here is an example:

Errors, warning, exceptions
Log levels are used to clearly identify exceptions. All warnings are logged at WARN logging level. All exceptions are ERROR or FATAL log levels.
How to identify what log to look in
Many issues are highly reproducible. Try to identify the conditions resulting in an issue. Being able to reproduce an issue on demand helps issue resolution and investigation.
Determining which log file to look into often comes with experience.
·webui user interface errors/issues
·services database upgrades and scheduled task execution
·*client* problems with an actual module
·*core* problems with retrieving and processing of commands
How to adjust logging levels
Go to Configuration > Modules, then select the desired module and choose the Set Log Level button. Changes take place almost instantly and there is no need for modules to be restarted.
Core logging level is set via System Configuration > General.
Identifying the point of failure
At the highest level, Archive Shuttle recommends to:
·Enable trace level logging on the Core (if appropriate) and modules which may be involved in the issue
·Try to repeat the activity of action which resulted in an error (for example retrying failed items, or retrying a Stage 2 workflow command)
·Search the log files for ERROR
·Check the thread ID of that error message and search in the logs for everything that the thread has done around about the time of the failure.
Shared mailbox over quota rollover
If a mailbox is over quota, a new one can be created automatically and any remaining data for this transformation is ingested into the new mailbox.
The new mailbox has a _1 suffix added, eg John.doe_1@domain.com. Additional rollovers for this container will be _2, _3 and so on.
There is a button in the user interface so that an operator can perform this action:
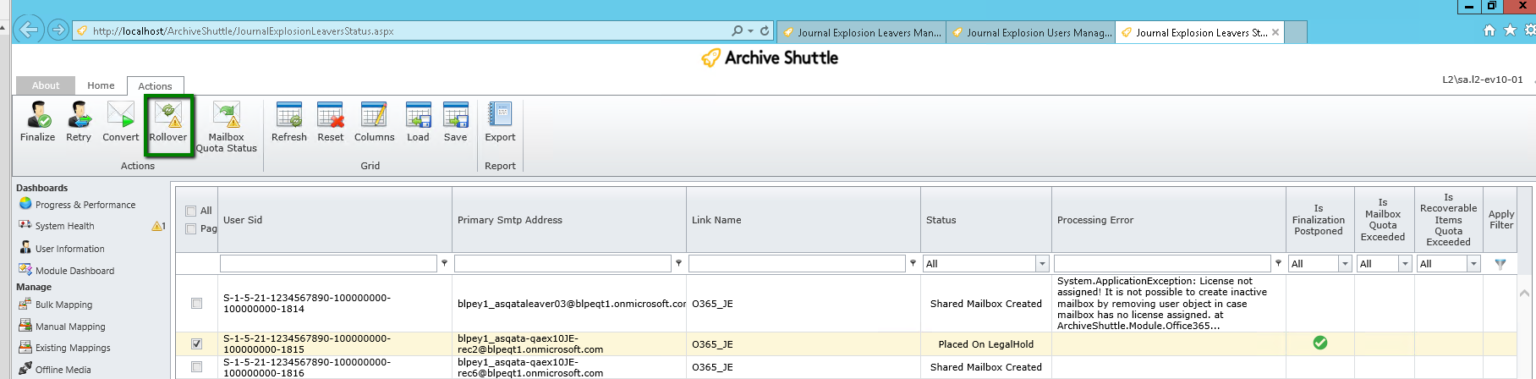
This is an additional possibility in a migration. Previously an over quota shared mailbox could be converted to a normal mailbox, but that consumes an additional Microsoft license. By creating a new, shared mailbox additional licenses are not consumed. It is also shown to be faster ingesting into this type of mailbox compared with moving data from a primary mailbox to a secondary/personal archive mailbox.
Re-exporting a PST for a certain user
When migrating to PST, you might encounter corrupt PST files and need to re-export items for a certain user. Heres how to do it:
1.On the Stage 1 (Sync Data) page, expand the line that contains JC PST mappings.
2.Right-click on the Primary Smtp Address of the mapping that contains PSTs you want to view/re-import and select Show list of PSTs. A window opens showing associated PSTs.
3.Select the desired item(s) and click the Enable For Re-Export button.
|
|
NOTE: If you notice corrupt PST files that you want to re-export, but Stage 2 is complete, youll need to manually reset the workflow before you can re-export the PST files. |
Additional information
In step 2 above, when the window opens and displays the users PSTs, youll notice the windows URL includes the user, item database ID, and container mapping ID.
Limitations
A maximum of 10 PST files are processed (deleted/reset) for a Journal Explosion re-export. If needed, you can re-export remaining files after the first batch of 10 are ingested.