|
|
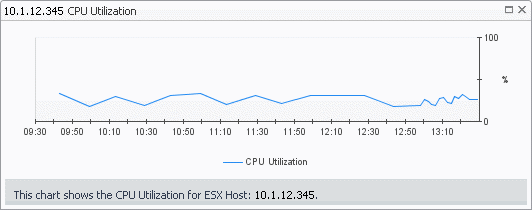
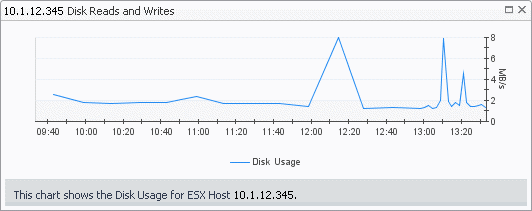
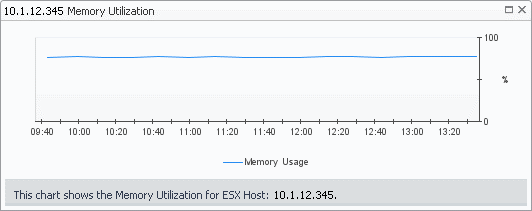
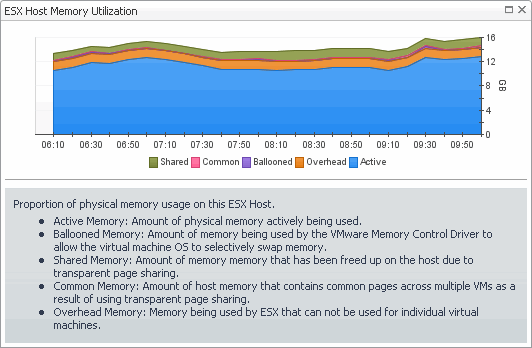
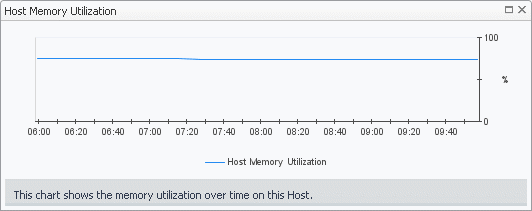
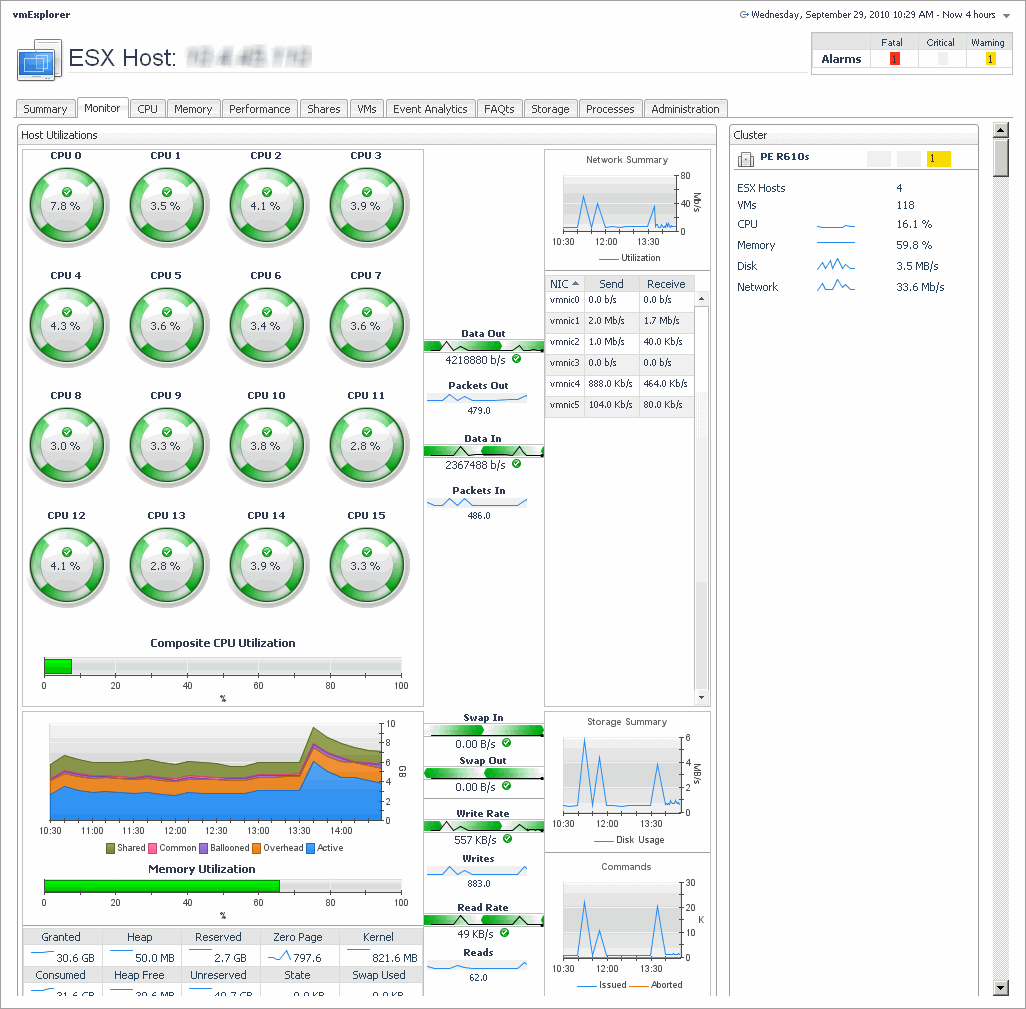
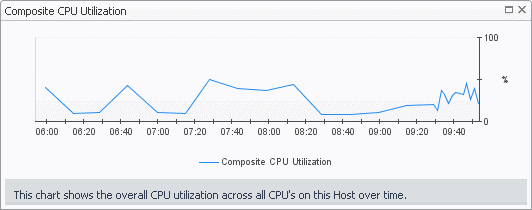
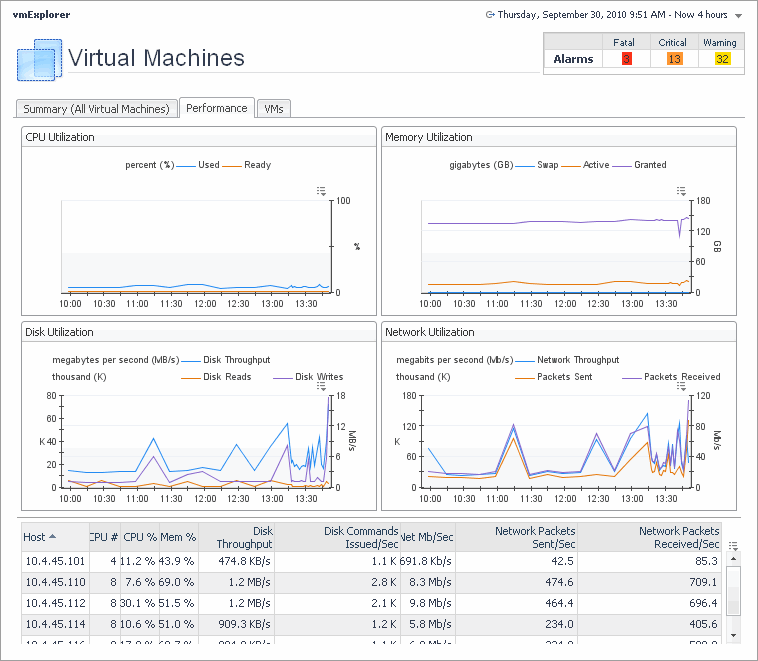
Shows the utilization of the selected ESX host’s resources.
|
|
|
|
• |
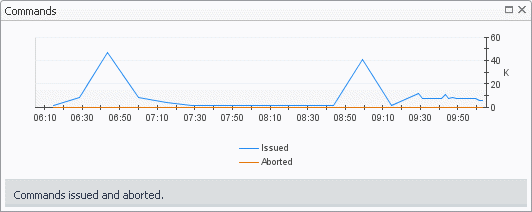
Commands, Aborted. The number of commands that are aborted during the selected time range. | |
|
|
|
• |
Commands, Issued. The total number of commands that are issued during the selected time range. | |
|
|
|
|
|
|
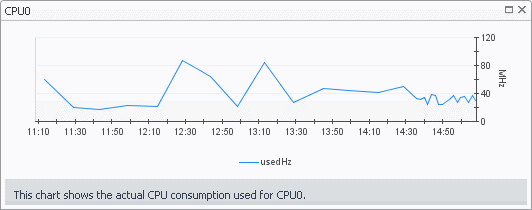
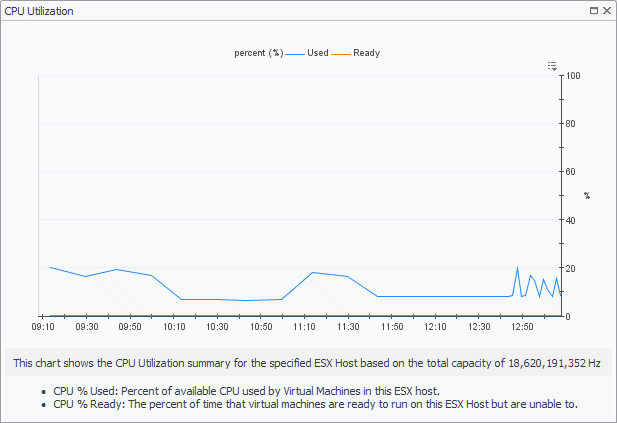
• |
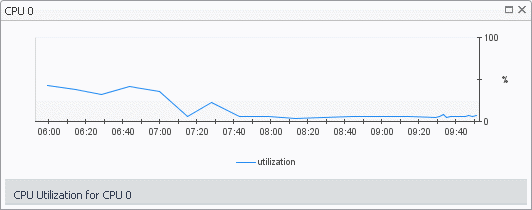
CPU 0-N. The current percentage of each individual CPU’s load, used to execute system code and user programs, based on the total CPU capacity. | |
|
|
|
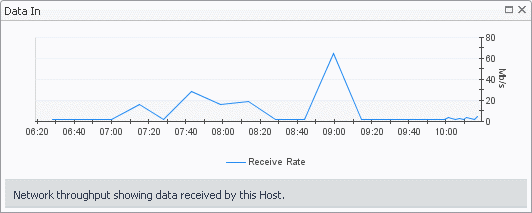
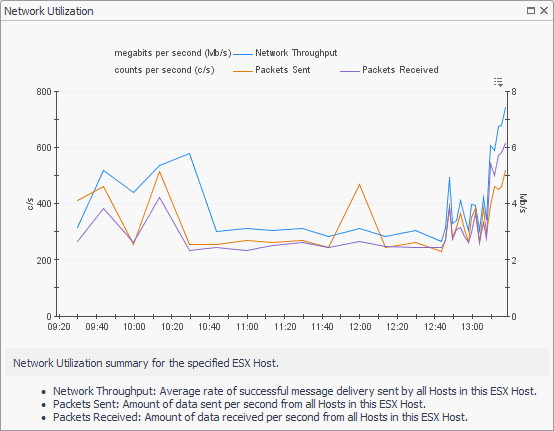
• |
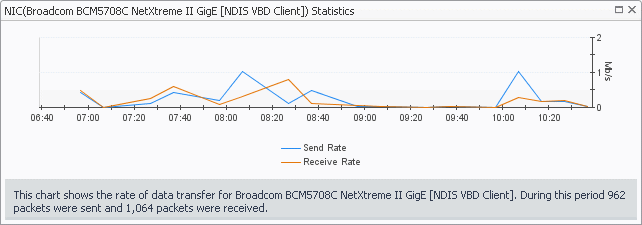
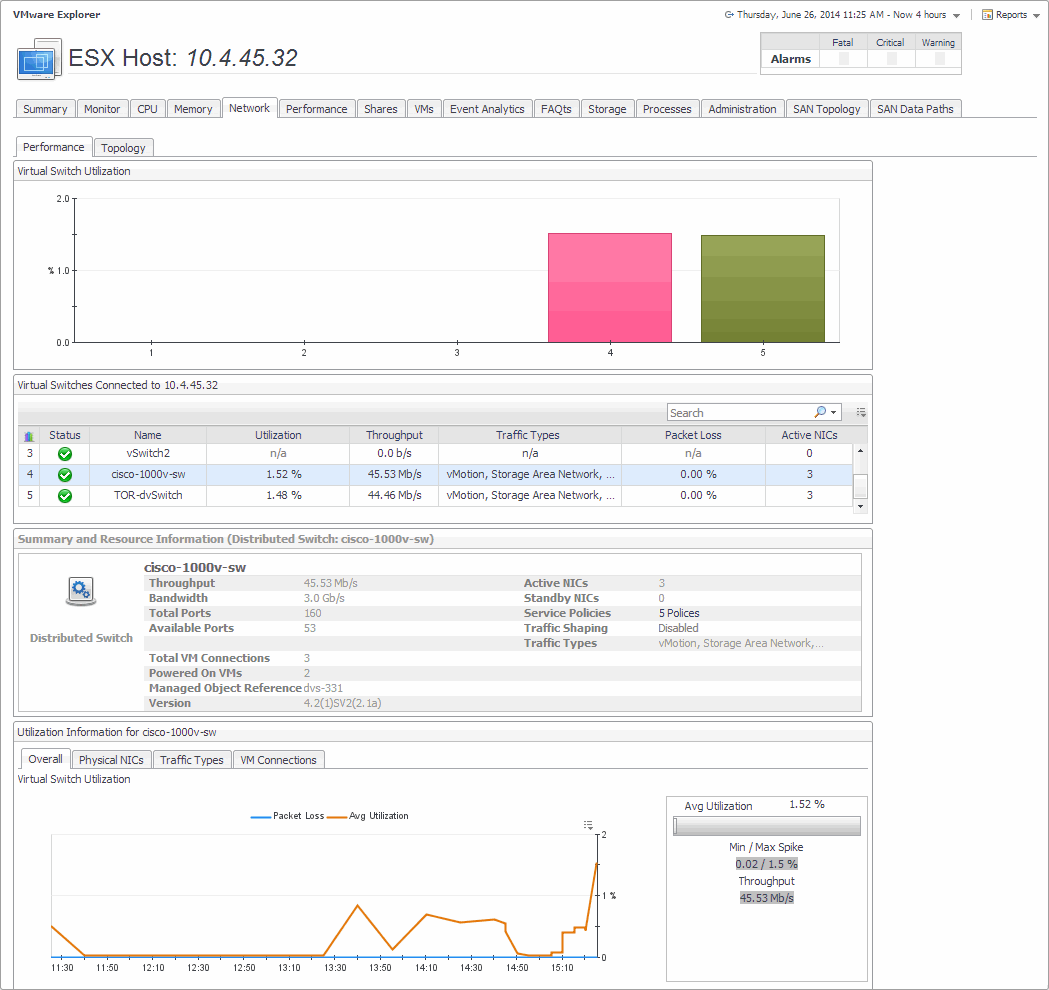
Data In. The rate at which data is received from the network during the selected time period. | |
|
|
|
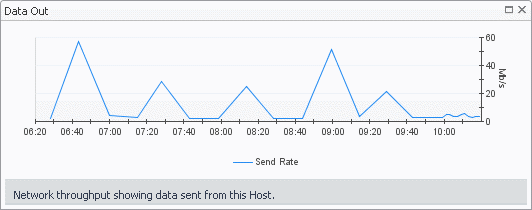
• |
Data Out. The rate at which data is transferred to the network during the selected time period. | |
|
|
|
|
|
|
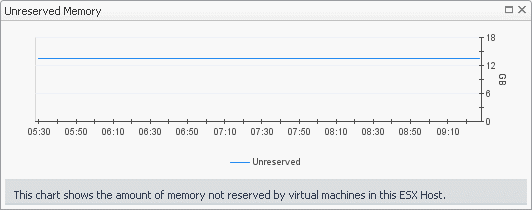
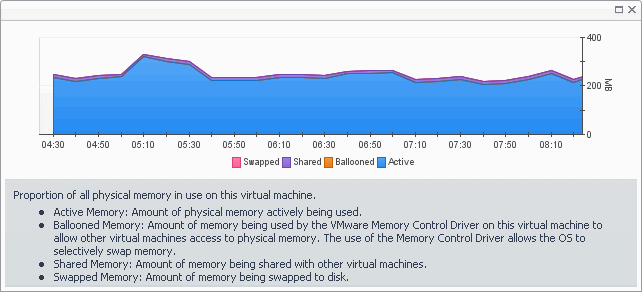
• |
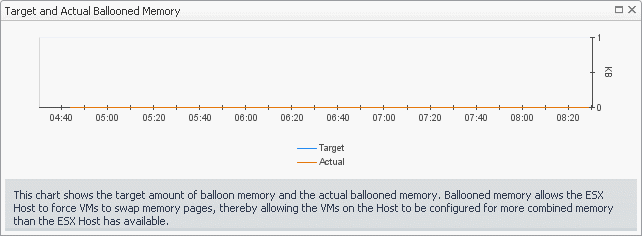
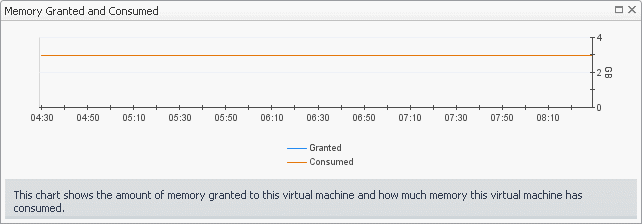
Memory Utilization, Ballooned. The amount of physical memory that is actively being used by the VMware Memory Control Driver to allow the guest OS to selectively swap memory. | |
|
|
|
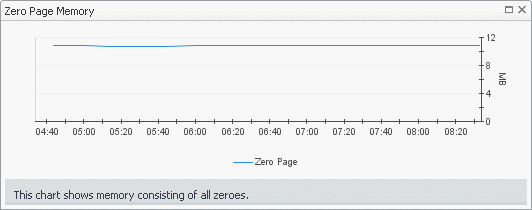
• |
Memory Utilization, Common: Amount of host memory that contains common pages across multiple virtual machines as a result of transparent page sharing. | |
|
|
|
|
|
|
|
|
|
|
|
|
|
|
|
|
|
|
|
|
|
|
|
|
|
|
|
|
|
|
|
|
|
|
|
|
|
|
|
|
|
|
|
|
|
|
|
|
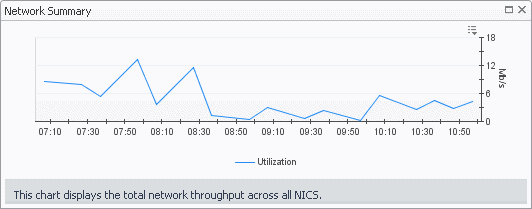
• |
Network Summary, Send. The current rate at which the network interface card transfers data to the network. | |
|
|
|
|
|
|
• |
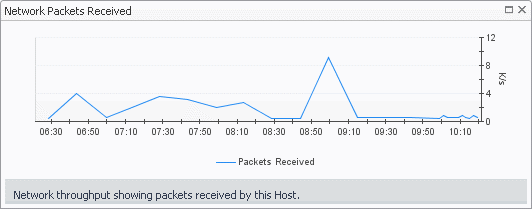
Packets In. The rate at which network packets are received during the selected time period. | |
|
|
|
• |
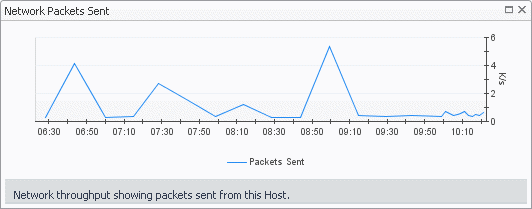
Packets Out. The rate at which network packets are sent during the selected time period. | |
|
|
|
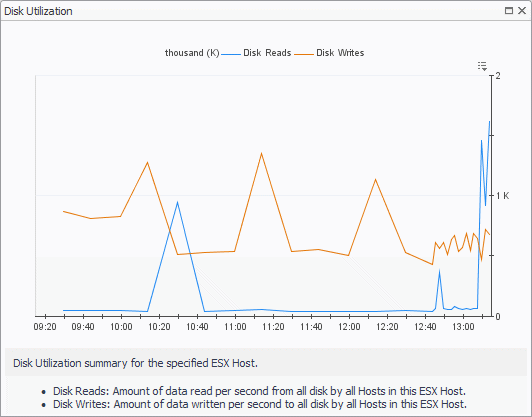
• |
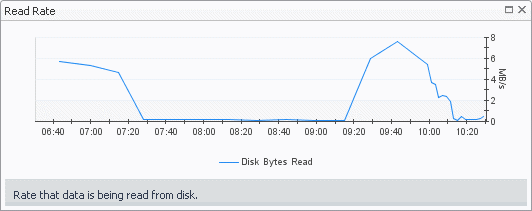
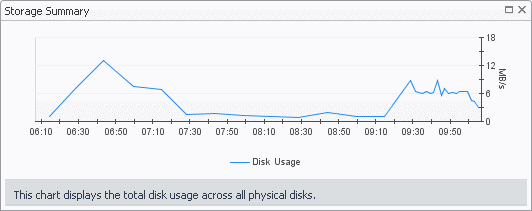
Read Rate. The rate at which data is read from the disk during the selected time period. | |
|
|
|
• |
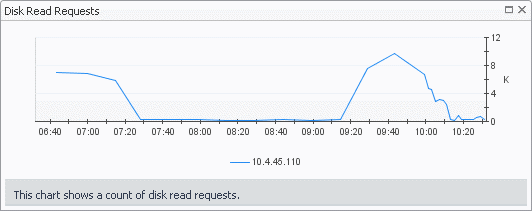
Reads. The percentage of elapsed time that the disk is busy servicing read requests during the selected time period. | |
|
|
|
|
|
|
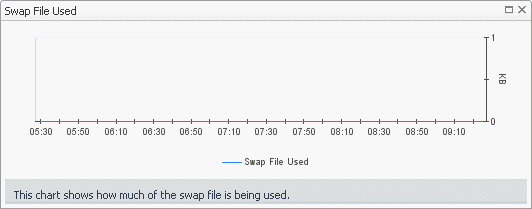
• |
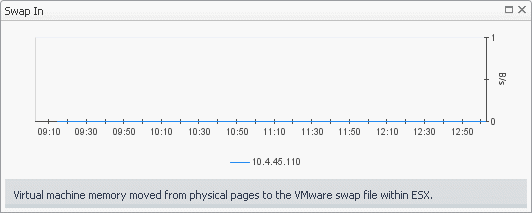
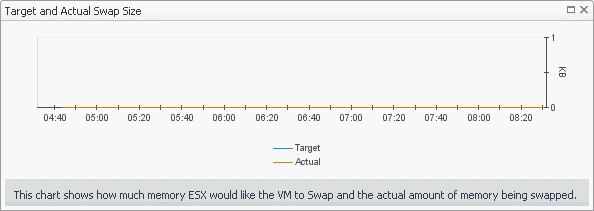
Swap In. The rate at which memory swap-ins occur. | |
|
|
|
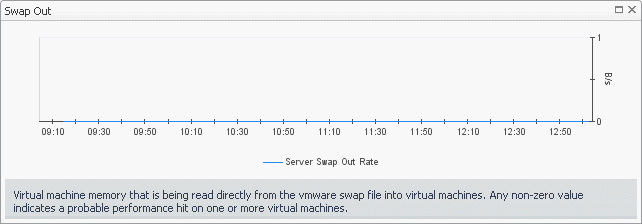
• |
Swap Out. The rate at which memory swap-outs occur. When memory becomes scarce, the OS swaps out sleeping processes, then swaps out active processes that use large amounts of memory. If swap-outs occur, the swap space can become critically low. | |
|
|
|
• |
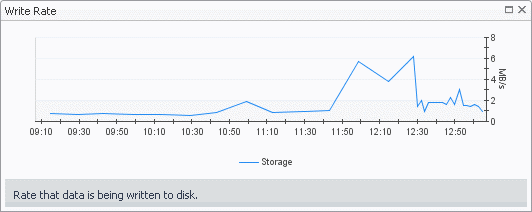
Write Rate. The rate at which data is written to the disk during the selected time period. | |
|
|
|
• |
Writes. The percentage of elapsed time that the disk is busy servicing write requests during the selected time period. | |
|
|
Drill down on: |
|
|
|
|
|
|
|
|
|
• |
CPU 0-N. Displays the CPU N dialog box. |
|
|
|
|
• |
Data In. Displays the Data In dialog box. |
|
|
|
|
• |
Data Out. Displays the Data Out dialog box. |
|
|
|
|
|
|
|
|
|
|
|
|
|
|
|
|
|
|
|
|
|
|
|
|
|
|
|
|
|
|
|
|
|
|
|
|
|
|
|
|
• |
Read Rate. Displays the Read Rate dialog box. |
|
|
|
|
• |
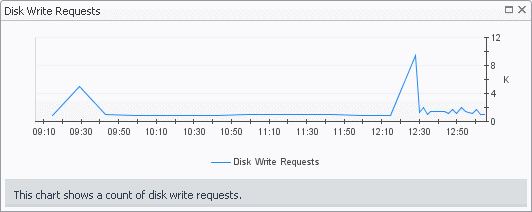
Reads. Displays the Disk Read Requests dialog box. |
|
|
|
|
|
|
|
• |
Packets In. Displays the Network Packets Received dialog box. |
|
|
|
|
• |
Packets Out. Displays the Network Packets Sent dialog box. |
|
|
|
|
• |
Swap In. Displays the Swap In dialog box. |
|
|
|
|
• |
Swap Out. Displays the Swap Out dialog box. |
|
|
|
|
|
|
|