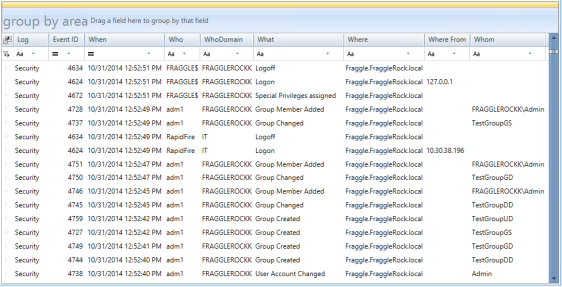
You can set up event display in the right pane exactly the way you want your search results to be presented, using sorting and grouping.
The default event view in Repository Viewer is a grid, and the default grid layout is a table, where the columns are named after event fields.
You can snap the column names together like building blocks, vertically as well as horizontally, to make compact layouts instead of using a plain table. The grid will use your block layout for every event it displays.

You may want to hide the fields you do not need or display the blocks that you want to work with. For that, click the icon next to the leftmost block name and change the selection in the Field Chooser toolbar. The following fields are available:
For details about the fields, see Filter Parameters.
Repository Viewer supports multi-level grouping of events, so that you can organize the results in tree-like views using any criteria. For example, you can group events by log, then by event ID, and then by user.
To use multi-level grouping, In the Events pane, drag column names from the event list to the area above the event grid. The event list changes accordingly.
To sort the results by a particular field, click that field's block in the grid. Clicking a block repeatedly toggles between ascending and descending order.
Items are sorted by name. However, for groups you also have the option of sorting items by count. To enable it, right-click the block you need in the grouping area and select Sort by count.

This option is set independently for each grouping level.
Hiding and unhiding events is useful when you need to repeatedly locate specific events in the same pool of audit data. This does not change your list of search results, but only specifies which parts of it are shown. It is quicker than redefining search filters and redoing searches every time, and if you are using a custom search, it helps you avoid modifying it.
To configure a view filter, use the controls underneath the column names in the event view: click the operator icon to select the operator, and specify the value to filter by. For details about operators, see the Filter Parameters topic.
Pie charts and column graphs are graphical alternatives to the grid-based textual representation of search results.
An event list can use multi-level grouping, but pie charts and column graphs work only if single-level grouping is used. In addition, the charts are most informative when they have only a few elements to display. Otherwise, the visual clutter can make them useless.
To switch to a non-default event view, select the Pie Chart or Column Graph tab.
In any event view, you can export the currently displayed events to a file. For that, click Report | Save Report button. In the save dialog box, you have the options of saving the current view "as is" or running a fresh search without an item limit and possibly with more recent results.
The Report drop-down menu also contains scheduling options. For details about scheduled reporting, see Reporting on Events Using Repository Viewer.
This example is based on an actual investigation, but the details have been changed. In the example environment, a business-critical server named acc05 hosts the payroll in a network share. Access to the share is controlled through share permissions. Only the members of the Finance and Accounting Active Directory group have read and write access.
Jake, the investigator, has grounds to suspect that some of the payroll files have been tampered with, and needs to perform forensic analysis. Here is how he does it using InTrust-collected audit data from the Security log and Change Auditor File Access Audit event log: