Chat now with support
Chat mit Support

Spotlight on Oracle 11.0 - Getting Started Guide

Welcome to Spotlight Install Spotlight Start Spotlight Spotlight on Oracle Spotlight on Oracle Data Guard Spotlight on Oracle RAC Spotlight on Unix Spotlight on Windows Troubleshooting: Connection Problems

Service Panel


The Service panel indicates the status of the Oracle communications between client and server.

Panel Components

Uptime The length of time the Oracle database has been running.
Container database

The name of the container for the pluggable database.

Note: Applicable to Oracle 12c.

Pluggable database

The name of the pluggable database.

When the Spotlight connection is to the container database, the displayed pluggable database is CDB$ROOT.

Note: Applicable to Oracle 12c.

Response The time it takes for the query select user from dual to be submitted, executed and returned.
Total Users The total number of users connected to the Oracle database.
Active Users The number of users who are currently active.
Avg Active

Note: Available for Oracle 10g and later.

Average Active Sessions shows the sum of DB time over all sessions, divided by elapsed time. The Average Active Sessions gauge breaks this down further by showing CPU time (dark colored bar) and other time (light colored bar) in relation to the CPU limit (vertical white line).
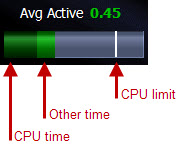
Average Active Sessions can help you determine if a database is experiencing performance issues. A value greater than the CPU limit, indicates potential performance issues. This is shown on the Average Active Sessions gauge as either of the colored bars passing the vertical white line. How far the colored bar has passed the vertical white line indicates the severity of the performance issue. A value far greater than the CPU limit indicates that the database is experiencing bottlenecks.

From here, you can drill down to see detailed information on the wait events that may be contributing to the database performance issues.

Data Flows

SQL*NET Send (KB/s)

The rate at which data is being transferred from Oracle server processes to user processes across the SQL*NET interface.

The Array Fetch Size Alarm is raised on this dataflow when the array fetch size for the database is too low.

SQL*NET Received (KB/s) The rate at which data from user processes is being transferred to the Oracle server across the SQL*NET interface.


Related Topics

Verwandte Dokumente

The document was helpful.

Bewertung auswählen

I easily found the information I needed.

Bewertung auswählen