Chat now with support
Chat mit Support

Foglight for VMware 6.0.0 - User Guide

Using Foglight for VMware
Introducing the virtual infrastructure Navigation basics Interacting with Foglight for VMware VMware Performance Agent configuration
Reference
Views
VMware Alarms views VMware Explorer views VMware Modeler views VMware VirtualCenter views VMware Environment views Other views
Rules
Agent Rules Cluster Rules Datacenter Rules Datastore Rules Resource Pool Rules ESX Server Rules VirtualCenter Rules Virtual Machine Rules VMW Stale Data Management Rule Virtual Switch Rules
Appendix: Alarm Messages Appendix: Metrics

Viewing baseline ranges

Foglight can estimate system performance by comparing metric values against a baseline range. A baseline establishes expected data patterns during a given time period. This feature is only available when your Foglight system includes a baseline cartridge with applicable metric definitions. Foglight for VMware uses the capabilities of the IntelliProfile cartridge, which enables the appearance of baseline data for ESX hosts and virtual machines on the VMware Environment and VMware Explorer dashboards.

Baseline data can also be displayed on custom dashboards and views for the following metric properties.

utilization

utilization

diskTransferRate

transferRate

active

consumed

active

consumed

Start creating a custom dashboard by clicking Create dashboard on the action panel. From there, create a view and add one or more of the data elements listed above. For complete information about custom dashboards and how to get started, refer to the Foglight User Help and the Creating Custom Dashboards learning video.

Before finishing, edit the view properties and enable the appearance of the baseline minimum and maximum values by selecting one or more of the Show baseline min/max as check boxes.

When you finish creating the custom dashboard, the blue line in the chart indicates metric values over time, while the grey shaded area represents the baseline range for the selected metric.

Exploring VMware alarms

The vmAlarms dashboard is a simple dashboard that shows the alarms that have been triggered but not cleared within Foglight for VMware. It can be used to isolate alarms specific to the virtualized environment.

Figure 38. VMware Alarms

To access this dashboard, from the navigation panel, under Dashboards, choose VMware > vmAlarms. For reference information about the data appearing on this dashboard, see VMware Alarms views .

Filtering alarms

The vmAlarms dashboard provides some filtering controls. Use it to isolate alarms related to a specific bottleneck or issue in your virtual environment. The Search box appears in the top-right corner of the alarm list.

Figure 39. Alarm filter

Type a text string and press ENTER. The list of alarms refreshes, showing only those alarms that match that filter.

For more advanced filtering, click the down-facing arrow, and in the list that appears, click Advanced Search. A dwell appears.

Figure 40. Advanced Search

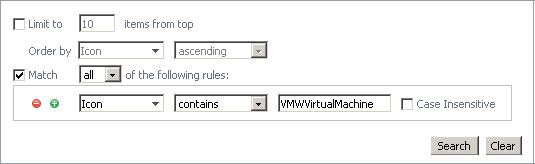
To search on a Foglight for VMware object name, select Match all of the following rules, and in the Icon box below, type a full or partial name of the object you want to search for, and then click Search. The Alarms List refreshes, showing only those alarms that are generated against the specified object type. For a list of icons and the related object names, see Virtual Infrastructure View Object Icons .

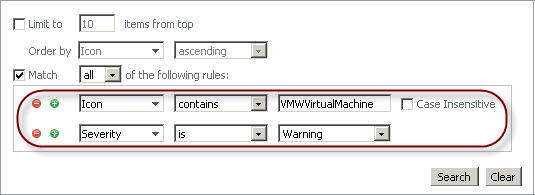
If you want to search on an alarm severity or rule name, or to combine different search criteria, update or add one or more rules in the Match all of the following rules area. For example, to search for alarms generated against a specific object type and have a specific severity, create one rule to specify the object type, and one for the rule severity.

Figure 41. Filtering rules

To search for alarms generated during a specific time, create a Time rule and specify the time range.

To search for a specific alarm message, create an Alarm Message rule and specify the message you want to search for.

To remove the filter, delete the search string and press ENTER. The list of alarms refreshes, showing all the generated alarms.

For more information on filtering lists in Foglight for VMware, refer to the Foglight for VMware User Guide.

Setting the alarm sensitivity level

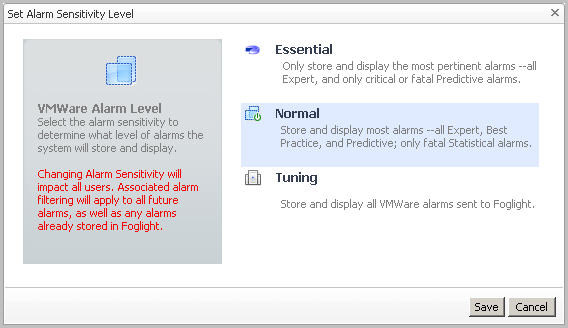
The Administration tab on the VMware Environment dashboard enables you to configure the level of alarm sensitivity. The Foglight® for VMware alarm sensitivity reflects the level of alarms the system stores and displays.

1
On the VMware Environment dashboard, open the Administration tab and click Set Alarm Sensitivity Level.
The Set Alarm Sensitivity Level dialog box appears.
3
Click Save.
Verwandte Dokumente

The document was helpful.

Bewertung auswählen

I easily found the information I needed.

Bewertung auswählen