Chat now with support
Chat mit Support

Foglight for VMware 5.8.2 - User and Reference Guide

Using Foglight for VMware
Introducing the virtual infrastructure Navigation basics Interacting with Foglight for VMware VMware Performance Agent configuration
Reference
Views
VMware Alarms views VMware Explorer views VMware Modeler views VMware VirtualCenter views VMware Environment views Other views
Rules
Agent Rules Cluster Rules Datacenter Rules Datastore Rules Resource Pool Rules ESX Server Rules VirtualCenter Rules Virtual Machine Rules VMW Stale Data Management Rule Virtual Switch Rules
Appendix: Alarm Messages Appendix: Metrics

Storage tab (Datacenter)

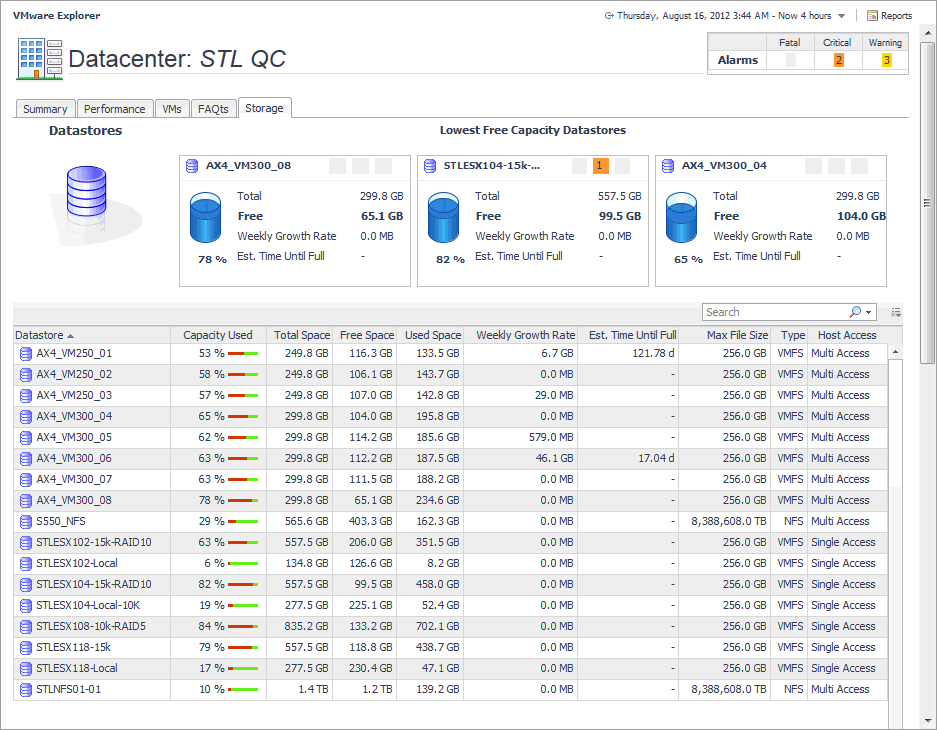
The VMware Explorer’s Storage tab displays the disk storage capacity associated with the selected component. Selecting a data center and opening this tab displays storage metrics for all Datastores associated with the selected Datacenter.

2
On the Virtual Infrastructure view, that appears on the navigation panel, select a Datacenter.

This view is made up of the following embedded views:

The Storage tab displays three tiles, identifying the datastores with the lowest amount of free space.

This view contains information about the used, free, and total space of the selected components’ datastores, along with projected short-term estimates, given the current growth patterns.

Datastore. The name of the selected datastore, followed by the related alarm counts.
Est. Time Until Full. The estimated amount of time until which this datastore will become full.
Free. The amount of free space for this datastore.
Total. The total amount of space for this datastore.
Weekly Growth Rate. The average amount of space the datastore expands every week.
Table 61. Datastores

Lists the datastores associated with the selected datacenter, and shows storage metrics associated with each datastore.

Capacity Used. The current percentage of the used disk space.
Datastore. The datastore name.
Est. Time Until Full. The estimated time after which the disk will be full.
Free Space. The amount of disk space that is free.
Host Access. The host access type.
Max File Size. The maximum file size.
Total Space.The total disk space, including used and free space.
Type. The file system type.
Used Space. The amount of used disk space.
Weekly Growth Rate. The estimated growth pattern of the used disk space.

Storage tab (ESX Host)

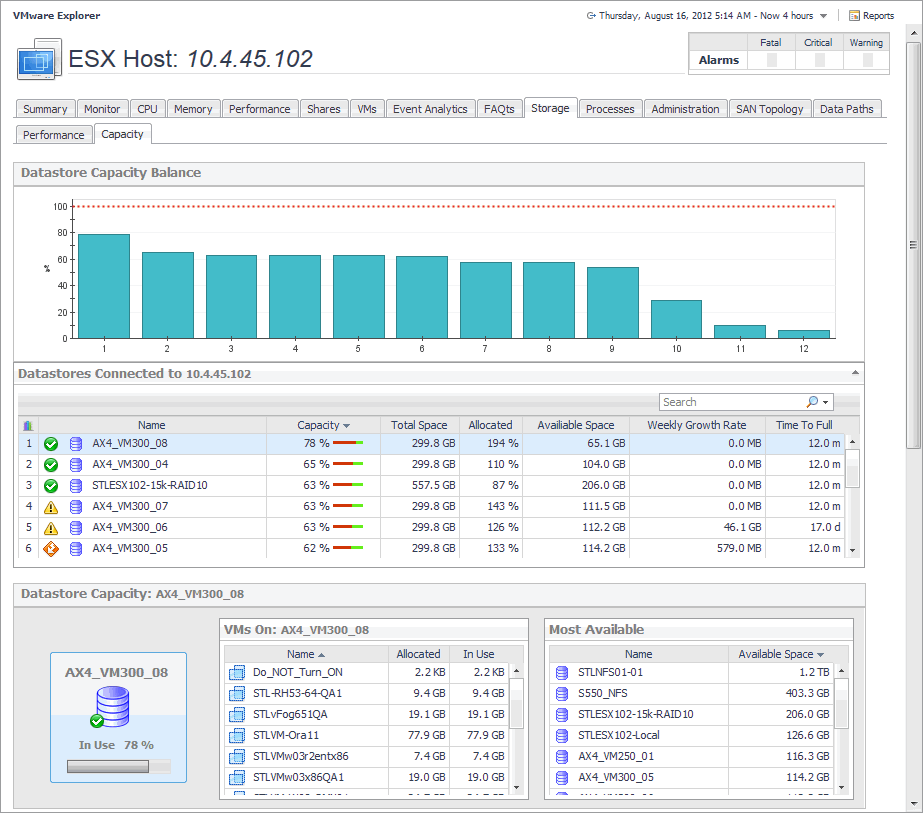
The VMware Explorer’s Storage tab displays the disk storage capacity associated with the selected component. Selecting an ESX host and opening this tab displays the storage metrics associated with the selected ESX host.

2
On the Virtual Infrastructure view, that appears on the navigation panel, select an ESX host.

This view is made up of the following embedded views:

This view contains information about the selected datastore data capacity.

Datastore, In Use. The percentage of disk space in use.
Most Available, Available Space. The disk space available on the datastore.
Most Available, Name. The name of the datastore.
VMs On Datastore, Allocated. The amount of memory allocated to the virtual machine.
VMs On Datastore, In Use. The amount of memory used by the virtual machine.
VMs On Datastore, Name. The name of the virtual machine associated with the datastore.

This view shows the datastore capacity for each datastore connected to the selected ESX host.

This view shows the data transfer rates for each datastore connected to the selected ESX host.

This view shows a the amount I/O resources used by the virtual machines associated with the selected datastore.

Disks/Extents, Name (VMFS and NFS datastores only). The name of the disk associated with the datastore. For more information about VMFS and NFS datastores, see Datastores .
Disks/Extents, Read (VMFS and NFS datastores only). The rate at which the data is read from the disk.
Disks/Extents, Read Latency (VMFS and NFS datastores only). The read latency of the disk.
Disks/Extents, Write (VMFS and NFS datastores only). The rate at which the data is written to the disk
Disks/Extents, Write Latency (VMFS and NFS datastores only). The write latency of the disk.
I/O Distribution. A pie chart indicating how much the individual virtual machines contributed to the use of I/O resources.
VM Offenders, Name. The name of the virtual machine.
VM Offenders, ESX Host Name. The name of the ESX host on which the ESX machine is running.
VM Offenders, I/O. The data transfer rate for the virtual machine.
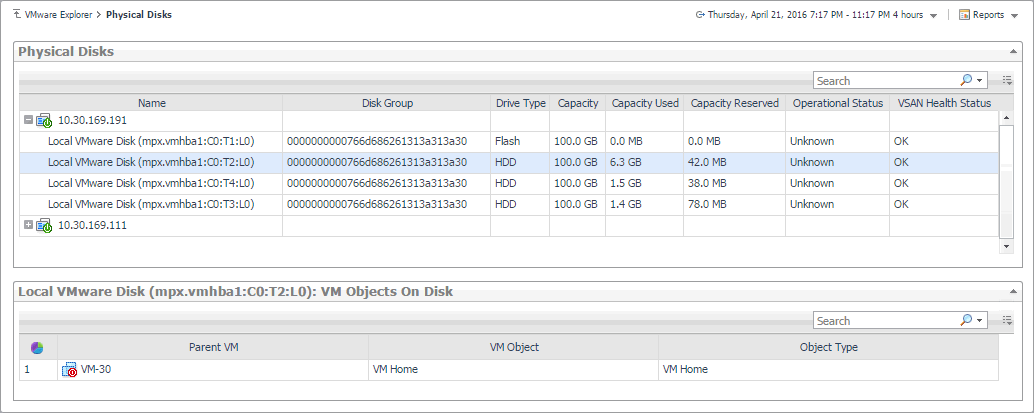
Vsan Disks (VSAN datastores only). Click Explore Physical Disks view to display the more information about physical disks.

This view lists the datastores connected to the selected ESX host and shows performance metrics associated with each datastore.

Available Space. The amount of available space on the datastore.
Latency. The datastore latency.
My I/O. The datastore data transfer rates associated with the selected ESX host.
Name. The datastore name and its alarm status.
Total I/O. The total datastore data transfer rate.

This view shows the data transfer rates for each storage adaptor associated with the selected ESX host.

This view lists the storage adaptors associated with the selected ESX host, and shows performance metrics for each adaptor.

Name. The storage adaptor name.
Read. The storage adaptor data read rates.
Read Latency. The storage adaptor read latency.
Write. The storage adaptor data write rates.
Write Latency. The storage adaptor write latency.

Storage tab (Virtual Machine)

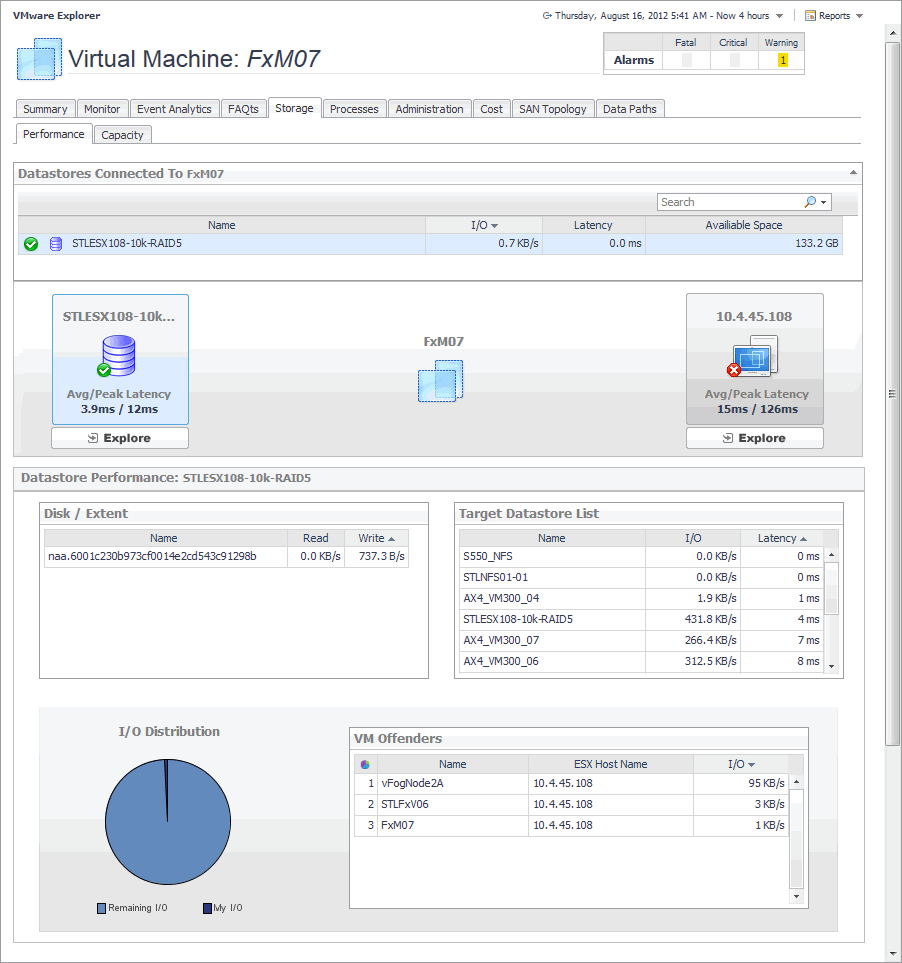
The VMware Explorer’s Storage tab displays the disk storage capacity associated with the selected component. Selecting a virtual machine and opening this tab displays the storage metrics associated with the selected virtual machine.

2
On the Virtual Infrastructure view, that appears on the navigation panel, select a virtual machine.

This view is made up of the following embedded views:

This view contains information about the selected datastore and virtual machine data capacity.

Datastore, Current Utilization, Allocated. The amount and percentage of disk space allocated to the datastore.
Datastore, Current Utilization, Available Space. The disk space available on the datastore.
Datastore, Current Utilization, Capacity. The total disk space on the datastore.
Datastore, Current Utilization, In Use. The amount and percentage of disk space the datastore uses.
Datastore, In Use. The percentage of disk space in use by the datastore.
Virtual Machine, Current Utilization, Allocated. The amount and percentage of disk space allocated to the virtual machine.
Virtual Machine, Current Utilization, In Use. The amount and percentage of disk space the virtual machine uses.
Virtual Machine, In Use. The percentage of disk space in use by the virtual machine.

This view shows the amount of I/O resources used by the datastore associated with the selected virtual machine.

Disk/Extent, Name. The name of the disk associated with the datastore.
Disk/Extent, Read. The read rate of the disk associated with the datastore.
Disk/Extent, Write. The write rate of the disk associated with the datastore.
I/O Distribution. A pie chart indicating how much the selected virtual machines contributes to the overall use of I/O resources.
Target Datastore List, I/O. The data transfer rate of the target datastore.
Target Datastore List, Latency. The data transfer latency of the target datastore.
Target Datastore List, Name. The name of the target datastore.
VM Offenders, ESX Host Name. The name of the ESX host on which the ESX machine is running.
VM Offenders, I/O. The data transfer rate for the virtual machine.
VM Offenders, Name. The name of the virtual machine.

This view lists the datastores connected to the selected virtual machine and shows performance metrics associated with each datastore.

Available Space. The amount of available space on the datastore.
Datastore, Avg/Peak Latency. The average and peak latency rates for the selected datastore.
ESX Host, Avg/Peak Latency. The average and peak latency rates for the ESX host associated with the selected virtual machine.
Latency. The datastore latency.
I/O. My I/O. The datastore data transfer rates associated with the selected ESX host.
Name. The datastore name and its alarm status.
Total I/O. The total datastore data transfer rate.

This view lists the logical disks associated with the selected virtual machines and shows their performance metrics.

Available Space. The space currently available on the logical disk.
Capacity. The logical disk capacity.
In Use. The amount of disk space used by the logical disk.
Logical Disk. The name of the logical disk.
Time To Full. The estimated time after which the disk will be full.
Total Space. The total space allocated to the logical disk.
Weekly Growth Rate. The estimated growth pattern of the used disk space.

Summary tab

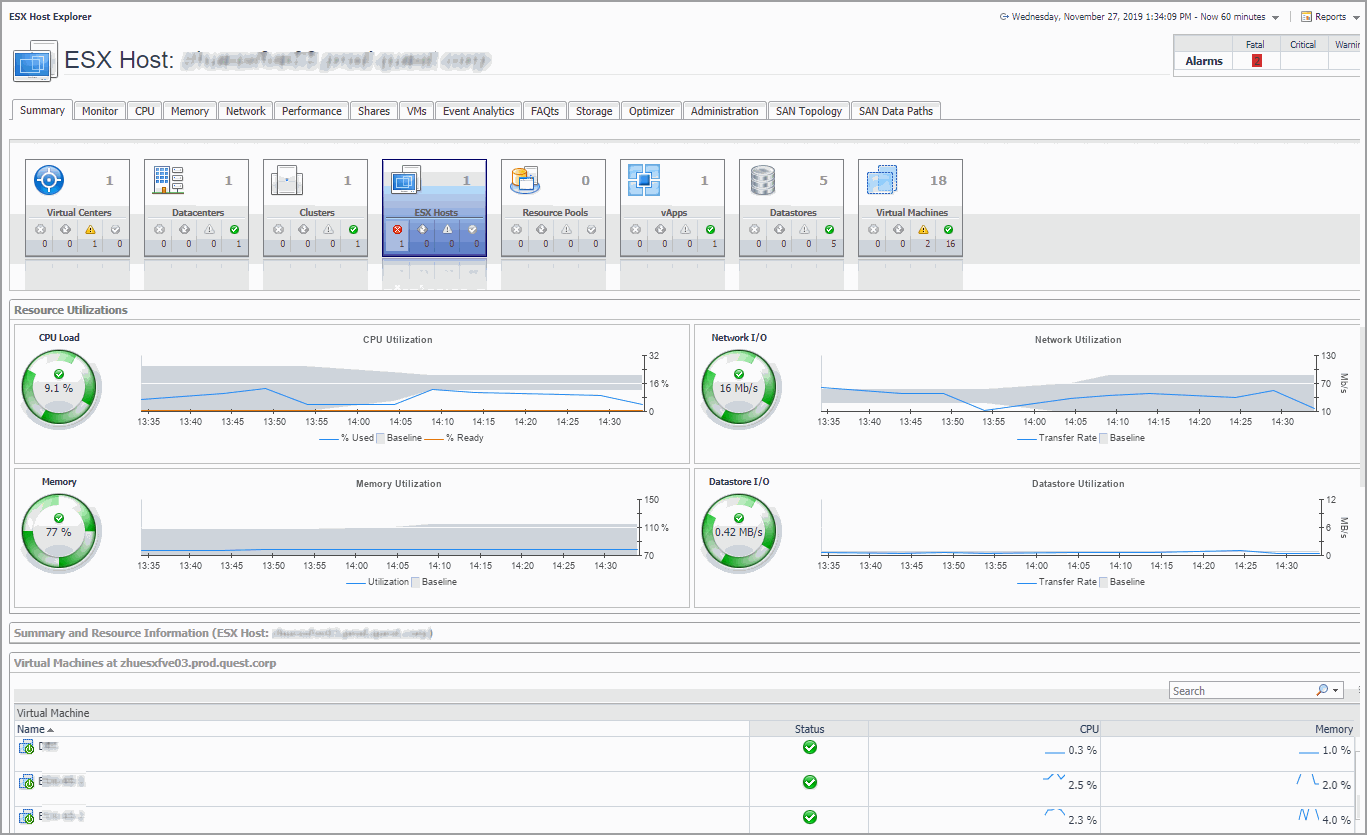
The Summary view provides a hierarchical inventory, in the form of tiles, of the objects that are related to the object or group of objects selected.

Figure 78. Summary tab

Each tile shows the number of instances of the corresponding object type, as well as the counts of objects of that type in each of the alarm states (Normal, Warning, Critical, Fatal).

More detailed information for the selected object or objects is displayed in the collapsible views below the Summary view.

On a tile, click the object type icon, the object type name, or the object count, to view a popup that lists all objects of the corresponding type, along with their respective states. Click a column header on the popup to change the sort order. Click an object in the popup list to view details for that object in the VMware Explorer dashboard.

On a tile, click an alarm state icon or the number below it to view a popup that shows the outstanding alarms of that state for the corresponding object type.

If an alarm state has a count of zero, then you can not select that alarm state. When you click a normal state icon or count, the VMware Explorer page is refreshed, but you do not see an alarm popup because there are no alarms associated with the normal state.

2
In the Virtual Infrastructure view, select a Virtual Center, datacenter, cluster, ESX host, resource pool, or a virtual machine.
The Summary tab is the first tab you see open in the display area.

This view is made up of the following embedded views:

Table 73. Cluster

Shows a list of clusters associated with the selected datacenter.

CPU Used. The amount of CPU processing power used by all ESX hosts associated with the cluster and the selected datacenter.
Hosts. The number of ESX hosts associated with the cluster and the selected datacenter.
Memory. The percentage of total memory used by all ESX hosts associated with the cluster and the selected datacenter.
Name. The cluster name.
Resource Pools. The number of resource pools associated with the cluster and the selected datacenter.
Status. The status of the cluster, associated with any alarms raised against that virtual machine. If no alarms are fired, the status appears as Normal. Otherwise, the status is set to the alarm severity (Warning, Critical, or Fatal).

Drill down on any cluster entry. The Summary tab refreshes, showing the cluster details

Table 74. ESX Hosts

Shows a list of ESX hosts associated with the selected cluster or datacenter.

ESX Host, CPU. The amount of CPU processing power used by the ESX host.
ESX Host, HBAs. The number of host adapters that exist on the ESX host.
ESX Host, Memory. The percentage of total memory used by the ESX host.
ESX Host, Name. The virtual machine name.
ESX Host, NICs. The number of network interface cards that exist on the ESX host.
ESX Host, Status. The status of the virtual machine, associated with any alarms raised against that virtual machine. If no alarms are fired, the status appears as Normal. Otherwise, the status is set to the alarm severity (Warning, Critical, or Fatal).
ESX Host, Version. The version of the VMware ESX Server application installed on the host.
Virtual Machines, Configured. The number of virtual machines that are configured to run on the ESX host.
Virtual Machines, Running. The number of virtual machines currently running on the host.

Drill down on any ESX host entry. The Summary tab refreshes, showing the ESX host details.

Table 75. Notes

Shows additional notes about the selected virtual machine.

Table 76. Resource Pool

For complete information about this view, see Resource Pools Relationship Tree view .

Shows the resource consumption for the selected cluster, server, or virtual machine broken down into four simple views.

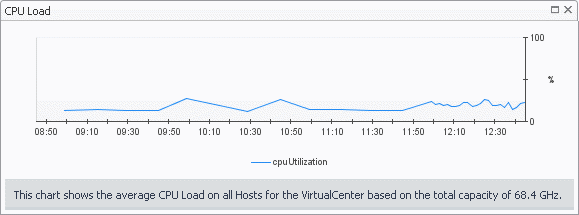
CPU Load. The current percentage of the selected component’s (cluster, server, or virtual machine) CPU load, used to execute system code and user programs, based on the total CPU capacity available to that component.
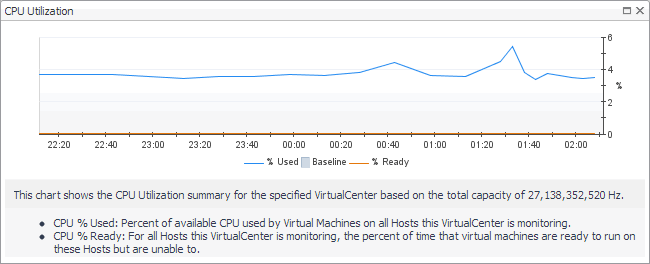
CPU Utilization, % Used. The percentage of the selected component’s (cluster, server, or virtual machine) CPU utilization spent on executing system code and user programs during the selected time period.
CPU Utilization, % Ready. The percentage of the selected component’s (cluster, server, or virtual machine) CPU resources that are ready to execute system code and user programs during the selected time period.
CPU Utilization, Baseline. An envelope indicating the expected CPU utilization range based on historical data.
Datastore I/O. The current datastore I/O rate for the selected ESX host.
Datastore Utilization, Baseline. An envelope indicating the expected datastore utilization range based on historical data.
Datastore Utilization, Transfer Rate. The rate at which data was read from and written to the datastore of the selected ESX host during the specified time period.
Datastore Utilization, Write Rate. The rate at which data was written to the datastore of the selected component during the specified time period.
Datastore I/O. The current datastore I/O rate for the selected server or cluster.
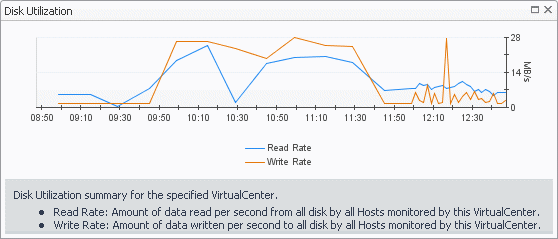
Disk Utilization, Baseline. An envelope indicating the expected disk utilization range based on historical data.
Disk Utilization, Transfer Rate. The rate at which data was read from and written to the disks of the selected component during the specified time period.
Disk Utilization, Write Rate. The rate at which data was written to the disks of the selected component during the specified time period.
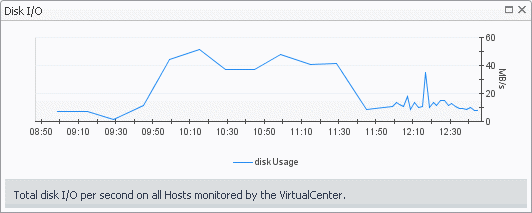
Disk I/O. The current disk I/O rate for the selected server or cluster.
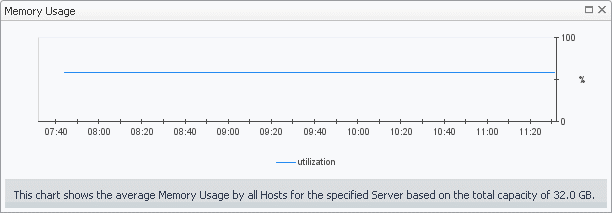
Memory Usage. The current percentage of the average memory usage by the selected component (server or cluster).
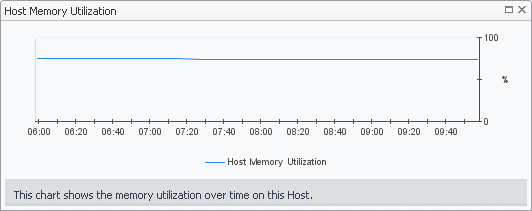
Memory Utilization, Baseline. An envelope indicating the expected memory utilization range based on historical data.
Memory Utilization, Utilization. The percentage of the available memory that the selected component (server or cluster) uses during the specified time period.
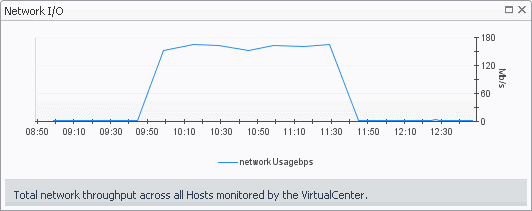
Network I/O. The current rate at which the selected component (cluster, server, or virtual machine) transfers data from and to the network.
Network Utilization, Baseline. An envelope indicating the expected network utilization range based on historical data.
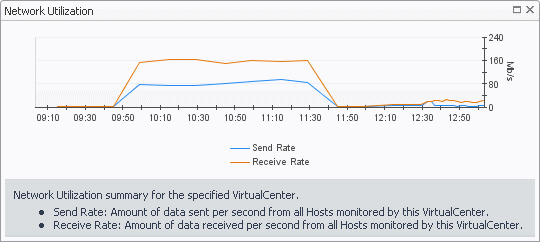
Network Utilization, Transfer Rate. The rate at which the selected component (cluster, server, or virtual machine) receives and sends data to the network during the selected time period.

Drill down on:

CPU Load spinner. Displays the CPU Load dialog box.
CPU Utilization graph. Displays the CPU Utilization dialog box.
Disk I/O spinner. Displays the Disk I/O dialog box.
Disk Utilization graph. Displays the Disk Utilization dialog box.
Memory Usage spinner. Displays the Memory Usage dialog box.
Memory Utilization graph. Displays the Memory Utilization dialog box.
Network I/O spinner. Displays the Network I/O dialog box.
Network Utilization graph. Displays the Network Utilization dialog box.
Table 78. Servers

Shows a list of servers that belong to the selected cluster.

Server, CPU. The current percentage of the server’s CPU load, used to execute system code and user programs, based on the total CPU capacity.
Server, Memory. The current percentage of the server’s memory usage by the selected component.
Server, NICs. The number of network interface cards that the server uses.
Server, Server Name. The server name.
Server, Status. The server status, associated with any alarms raised against that server. If no alarms are fired, the status appears as Normal. Otherwise, the status is set to the alarm severity (Warning, Critical, or Fatal).
Server, Version. The operating system version.
Virtual Machines, Configured. The number of virtual machines that exist on the server.
Virtual Machines, Running. The number of virtual machines that are currently running on the server.

Drill down on any server entry. The VMware Explorer dashboard appears, showing the server details on the Summary tab.

Shows physical configuration details for the selected server or virtual machine.

Datacenter. The name of the datacenter associated with the cluster.
Datastores. The number of datastores associated with the selected cluster.
ESX Hosts. The number of ESX hosts that belong to the selected cluster.
Memory Capacity. The combined memory capacity of the servers that belong to the selected cluster.
Network Interfaces. The number of network interface cards used by the servers that belong to the selected cluster.
Processing Power. The CPU speed available to the selected cluster.
Resource Pools. The number of resource pools associated with the cluster.
Virtual Center. The IP address of the Virtual Center to which the cluster belongs.
Virtual Machines Hosted. The number of virtual machines hosted in the selected cluster.
Cluster. The name of the cluster to which the selected ESX host belongs.
Computing Capacity. The CPU processing power available to the ESX host.
Connection Status. The ESX host’s connection status.
Current Status. The current status of the selected ESX host: Turned off or Powered On.
Datastores. The number of datastores associated with the ESX host.
DNS Name. The fully qualified DNS name of the host.
ESX Software Version. The VMware application version.
Memory Capacity. The memory capacity of the selected ESX host.
Network Interfaces. The number of network interface cards that exist on the ESX host.
Processors. The number of CPUs used by the selected server.
Virtual Machines Count. The number of virtual machines running on the selected server.
VM’s Powered On Count. The number of virtual machines that exist on the host that are currently powered on.
Cluster. The name of the cluster to which the selected virtual machine belongs.
Connection Status. The virtual machine’s connection status.
Current Status. The current status of the selected virtual machine: Turned off or Powered On.
Datacenter. The name of the datacenter associated with the virtual machine.
DNS Name. The fully qualified DNS name of the virtual machine.
ESX Host. The IP address of the ESX host on which the virtual machine is running.
IP address. The IP address of the virtual machine.
Memory Capacity. The amount of memory resources allocated to the virtual machine.
Network Interfaces. The number of network interface cards used by the selected virtual machine.
OS. The name of the operating system used by the selected virtual machine.
Processors. The number of CPUs used by the selected virtual machine and the number of the CPU shares.
Resource Pools. The name of the resource associated with the virtual machine.
Storage Devices. The number of physical and logical disks associated with the virtual machine.
Uptime. The percentage of time during which the virtual machine is running.
Virtual Center. The IP address of the Virtual Center to which the virtual machine belongs.
Vmware Tools. The name of VMware applications used to manege the virtual machine.
Clusters. The number of clusters associated with the datacenter.
Combined Processing. The combined CPU processing power available to the datacenter.
Datastores. The number of datastores associated with the datacenter.
ESX Hosts. The number of ESX hosts associated with the datacenter.
Memory Capacity. The combined memory capacity available to the datacenter.
Network Interfaces. The number of network interface cards available to the datacenter.
Resource Pools. The number of resource pools associated with the datacenter.
Virtual Machines Hosted. The number of virtual machines associated with the datacenter.
CPU Limit. The maximum CPU processing power allocated to the datacenter.
CPU Reservation. The CPU processing power allocated to the datacenter.
CPU Shares. The state of CPU shares associated with the datacenter.
Memory Limit. The maximum memory resources allocated to the datacenter.
Memory Reserved. The memory resources allocated to the datacenter.
Memory Shares. The state of memory shares associated with the datacenter.
Nested Resource Pool(s). The number of child resource pools.
Parent. The host name or IP address of the resource pool parent element.
Virtual Machines. The number of virtual machines associated with the resource pool.

The VMware Explorer’s Virtual Environment view displays a high-level overview of your virtual environment. The view has a tile for each object type: Virtual Centers, Datacenters, Clusters, ESX Hosts, Resource Pools, Datastores, and Virtual Machines.

Each tile shows the number of the corresponding object instances in your virtual infrastructure, as well as the count of objects of that type in each of the alarm states (Normal, Warning, Critical, Fatal).

Alarm counts. The total counts of alarms associated with the clusters, servers, or virtual machines, broken down by alarm types (Normal, Warning, Critical, Fatal).
Cluster count. The number of clusters in the Virtual Center.
Datacenter count. The number of datacenters in the Virtual Center.
Datastore count. The number of datastores in the Virtual Center.
ESX Host count. The number of ESX hosts in the Virtual Center.
Resource Pools. The number of resource pools in the Virtual Center.
Virtual Machine count. The number of virtual machines in the Virtual Center
Virtual Center count. There can be only one Virtual Center in each model.

Drill down on:

Cluster. Displays the Clusters Inventory dwell, showing the names and states of one or more clusters associated with the selected component.
Datacenter. Displays the Datacenters Inventory dwell, showing the names and states of one or more datacenters associated with the selected component.
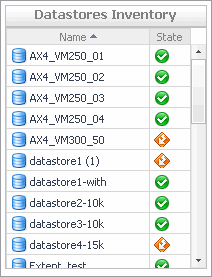
Datastores. Displays the Datastores Inventory dwell, showing the names and states of one or more datastores associated with the selected component.
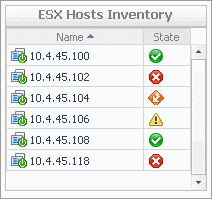
ESX Hosts. Displays the ESX Hosts Inventory dwell, showing the names and states of one or more ESX hosts associated with the selected component.
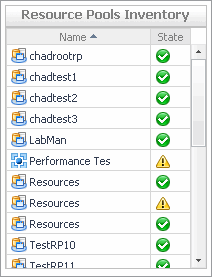
Resource Pools. Displays the Resource Pools Inventory dwell, showing the names and states of one or more resource pools associated with the selected component.
Virtual Center. Displays the Virtual Centers Inventory dwell, showing the name and state of the virtual center containing the selected component.
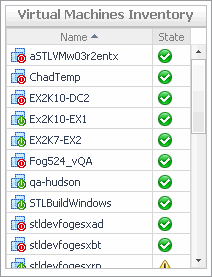
Virtual Machines. Displays the Virtual Machines Inventory dwell, showing the names and states of one or more virtual machines associated with the selected component.

Shows a list of virtual machines associated with the selected cluster or ESX host.

Name. The virtual machine name.
Status. The status of the virtual machine, associated with any alarms raised against that virtual machine. If no alarms are fired, the status appears as Normal. Otherwise, the status is set to the alarm severity (Warning, Critical, or Fatal).

Drill down on any virtual machine entry. The Summary tab refreshes, showing the virtual machine details.

Shows a list of asset tracking changes associated with the selected virtual machine and its resource pool.

Change. The change description.
Time. The date and time at which the change occurred.
Details. Additional details about the change.
Verwandte Dokumente

The document was helpful.

Bewertung auswählen

I easily found the information I needed.

Bewertung auswählen