Chat now with support
Chat mit Support

Foglight for Apache 5.9.0 - User Guide

Reference

Foglight for Apache ships with predefined views to help you monitor your application server environment. This topic provides quick reference information about each view. Foglight for Apache displays monitoring data in views that group, format, and display data.

Dashboards are top-level views that do not receive data from other views. Dashboards usually contain several lower-level views. The dashboards supplied with Foglight for Apache, and those created by users, are available in the navigation panel.

Lower-level views in Foglight for Apache can be added to dashboards or can be accessed by drilling down from a dashboard. They receive and display data directly from the Foglight Management Server or from other views. Some views filter or select data that appears in other views in the same dashboard. Some are tree views with expandable nodes for selecting servers, applications, or data.

Web Server Details view

The Web Server Details view provides information about the monitored web server as well as detailed information about web server performance and web site performance on the Performance tab and Web Sites tab respectively.

You can drill down to this view by clicking a web server name on the Summary – All Apache Web Servers view, or by clicking Explore on the Summary – <WebServerName> view.

This section provides a breakdown of details pulled from the Server Information and Server Status pages of the web server, including the following:

The configured display name of the Apache web server.

The version number of the Apache web server.

If the Apache web server has been configured using the Listen directive to listen for incoming connections on specific ports or selected addresses (or both), that binding information appears here.

The date and time the web server was last restarted.

The length of time since the web server was last restarted.

The name of the machine that hosts the web server.

The operating system of the monitored host.

The process name is either httpd (for Apache versions 2.2 and 2.4) or Apache (for versions 1.3 and 2.0).

The total number of times the web server was accessed since the last time it was restarted.

The total amount of traffic (bandwidth used) by the web server since the last time it was restarted.

Performance tab

The Performance tab is divided into three sections: Worker Status, Performance, and Top 5 Busy Web Sites.

The Worker Status chart on the Performance tab helps you visualize the state of workers on the web server. Use the list of check boxes to show or hide the types of worker status that you want to review from the eleven types available.

By default, all status types except Waiting for Connection and Open slot with no current process are selected and shown.

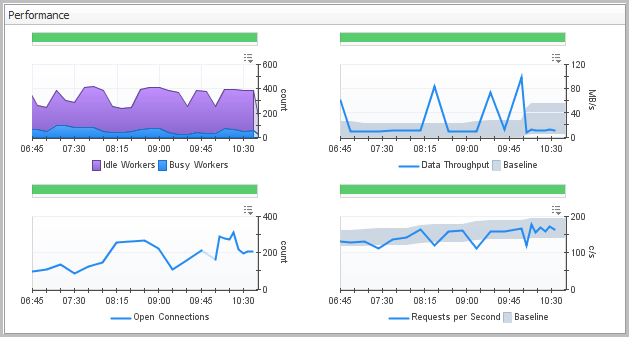
The Performance charts on the Performance tab provide an at-a-glance overview of four key web server metrics and their overall health: idle/busy workers, data throughput, open connections, and requests per second.

The colored bar above each chart indicates the health of that metric. The color changes when an alarm occurs.

The Data Throughput and Requests per Second charts include a baseline envelope that enables you to quickly see when values are above or below the typical operating range. For more information about baselines, see Analyzing Activity Levels with IntelliProfile in the Foglight Administration and Configuration Guide.

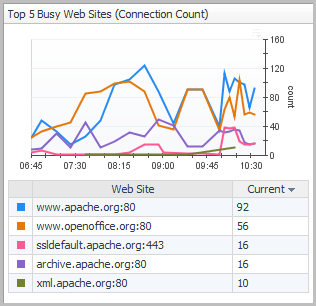
The Top 5 Busy Web Sites chart on the Performance tab allows you to compare the five web sites with the highest connection count.

Figure 6. Web Site Summary pop-up view

This view displays the Site Binding information (if available), and three charts: Connection Count, Client Count, and Traffic. You can also access this information on the Web Sites tab.

Web Sites tab

The Web Sites tab lists all web sites hosted on the selected Apache web server. It also provides site binding information (if applicable), and connection count, client count, and traffic information.

The Web Sites tab provides the following information for all sites hosted on the selected web server:

Web site name.

If the Apache web server has been configured using the Listen directive to listen for incoming connections on specific ports or selected addresses (or both), that binding information appears in this box.

Displays the current number of connections, as a numeric value, as well as a sparkline of the connection count trend over the time range selected in the zonar (for example, 4 hours). Hover the mouse pointer over the sparkline to open a graph of the connection count over time, or click the sparkline or count to open a Web Site Summary view.

Displays the current number of clients, as a numeric value, as well as a sparkline of the client count trend over the time range selected in the zonar (for example, 4 hours). Hover the mouse pointer over the sparkline to open a bar chart of the client count over time, or click the sparkline or count to open a Web Site Summary view.

Displays the current traffic (bandwidth use) for the web site as a numeric value, as well as a sparkline of the traffic trend over the time range selected in the zonar (for example, 4 hours). Hover the mouse pointer over the sparkline to open a bar chart of the traffic over time, or click the sparkline or count to open a Web Site Summary view.

Click any row in the table to open the Web Site Summary view for the selected web site.


Verwandte Dokumente

The document was helpful.

Bewertung auswählen

I easily found the information I needed.

Bewertung auswählen