
Monitoring File Groups in the Selected Databases
The File Groups pane displays detailed information about all file groups in the databases that are currently selected in the Databases table.
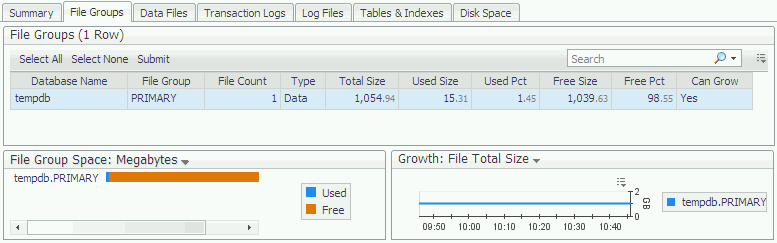
This pane includes the following areas:
The File Groups table shows information about all file groups in the selected database. File stream types (used by memory optimized objects and file-stream objects) are now supported.
|
Indicates whether the files in the file group (if any) can grow automatically as they fill. |
The File Groups Space chart displays the amount of space allocated to each file group. Each file group consists of used space and free space.
The Growth chart displays the amount by which each file group is growing over time.
Use the Growth list to change the values displayed on the chart. This list can be displayed by the total amount of space (File total size), used space (File used size), or unused space (File free size).
Monitoring data files
The Data Files pane displays detailed information about all data files in the database currently selected in the Databases table.
This pane includes the following areas:
To create a custom filter for this table, use the options accessible by clicking the Customizer button at the table’s upper right side. For details, see Components Shared by all Foglight for SQL Server Screens .
|
Growth increment. Indicates the amount by which the file grows every time, if the autogrow option is enabled. for example, if the data file’s initial size is 1 megabyte and it has to grow to a final size of 11 megabytes, setting the Growth Inc. parameter to 2 megabytes causes the file to grow five times, each time by a 2 megabyte increment. | |
|
The database name, concatenated with the database file name. |
The File Space chart displays the amount of space allocated to the data file for each selected database. Each data file consists of used and free space.
The chart values can be displayed in megabytes or as a percentage of disk space. Use the File Space list to change the values displayed on the chart.
The Data Files Growth chart displays, in megabytes, the amount by which each file is growing over time.
Use the Growth list to change the values displayed on the chart. This list can be displayed by the total amount of space (File Total Size), used space (File Used Size) or unused space (File Free Size).
Monitoring Transaction Logs in the Selected Database
The Transaction Logs pane displays detailed information about all transaction logs in the database currently selected in the Databases table.
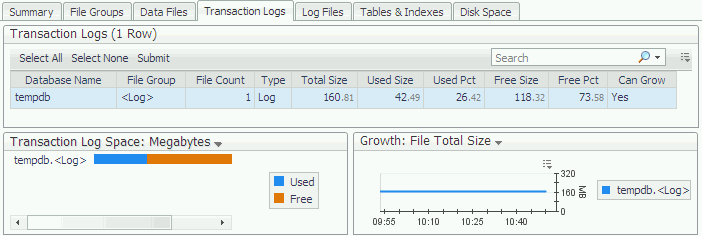
This pane includes the following areas:
The Transaction Logs table displays information about all transaction logs in the selected databases, as detailed in the following table.
|
The percentage of space available for use within the log file. | |
|
Indicates whether any of the files in the transaction log can grow. |
Transaction Log Space chart
The Transaction Log Space chart displays used space and free space for each of the selected databases’ transaction logs.
The chart values can be displayed in megabytes or as a percentage of disk space. Use the Transaction Log Space list to change the values displayed on the chart.
The Transaction Log Growth chart shows the amount by which each transaction log is growing over time.
Use the Growth list to change the values displayed on the chart. This list can be displayed by the total amount of either all transaction logs (File Total Size), used logs database (File Used Size), or unused transaction logs (File Free Size).