Chat now with support
Chat mit Support

Foglight for Container Management 2.0 - User Guide

Object Groups

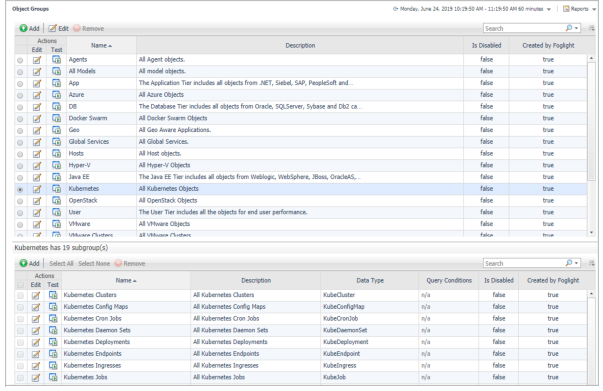
An object group is a mapping to a certain set of data types of the objects you are interested in.

To access the Object Groups dashboard, on the Navigation panel, click Dashboards > Services > Object Groups.

Select Docker Swarm or Kubernetes to display the subgroups.

Metrics


Table 4. Pod metrics

CPU Usage

CPU usage on all cores in millicores.

CPU Usage Rate

CPU usage rate on all cores in millicores/second.

CPU Request

CPU request (the guaranteed amount of resources) in millicores.

CPU Limit

CPU hard limit in millicores.

CPU Utilization

Percentage of CPU usage / CPU limit if user configured CPU limit for this pod.

Memory Usage

Total memory usage in bytes.

Memory Working Set

Total working set usage. Working set is the memory being used and not easily dropped by the kernel.

Memory Rss

RSS memory usage.

Memory Request

Memory request (the guaranteed amount of resources) in bytes.

Memory Limit

Memory hard limit in bytes.

Memory Page Faults

Number of page faults.

Memory Major Page Faults

Number of major page faults.

Memory Page Faults Rate

Number of page faults per second.

Memory Major Page Faults Rate

Number of major page faults per second.

Memory Utilization

Percentage of Memory usage / Memory limit if user configured Memory limit for this pod.

Network Send

Total send bytes.

Network Receive

Total receive bytes.

Network Send Rate

Total send bytes per second.

Network Receive Rate

Total receive bytes per second.

Network Send Errors

Total send errors count.

Network Receive Errors

Total receive errors count.

Network Send Errors Rate

Total send errors count per second.

Network Receive Errors Rate

Total receive errors count per second.

Network Transfer

Total send and receive bytes.

Network Transfer Rate

Total send and receive bytes per second.

Kubernetes metrics


Table 4. Pod metrics

CPU Usage

CPU usage on all cores in millicores.

CPU Usage Rate

CPU usage rate on all cores in millicores/second.

CPU Request

CPU request (the guaranteed amount of resources) in millicores.

CPU Limit

CPU hard limit in millicores.

CPU Utilization

Percentage of CPU usage / CPU limit if user configured CPU limit for this pod.

Memory Usage

Total memory usage in bytes.

Memory Working Set

Total working set usage. Working set is the memory being used and not easily dropped by the kernel.

Memory Rss

RSS memory usage.

Memory Request

Memory request (the guaranteed amount of resources) in bytes.

Memory Limit

Memory hard limit in bytes.

Memory Page Faults

Number of page faults.

Memory Major Page Faults

Number of major page faults.

Memory Page Faults Rate

Number of page faults per second.

Memory Major Page Faults Rate

Number of major page faults per second.

Memory Utilization

Percentage of Memory usage / Memory limit if user configured Memory limit for this pod.

Network Send

Total send bytes.

Network Receive

Total receive bytes.

Network Send Rate

Total send bytes per second.

Network Receive Rate

Total receive bytes per second.

Network Send Errors

Total send errors count.

Network Receive Errors

Total receive errors count.

Network Send Errors Rate

Total send errors count per second.

Network Receive Errors Rate

Total receive errors count per second.

Network Transfer

Total send and receive bytes.

Network Transfer Rate

Total send and receive bytes per second.

Pod metrics


Table 4. Pod metrics

CPU Usage

CPU usage on all cores in millicores.

CPU Usage Rate

CPU usage rate on all cores in millicores/second.

CPU Request

CPU request (the guaranteed amount of resources) in millicores.

CPU Limit

CPU hard limit in millicores.

CPU Utilization

Percentage of CPU usage / CPU limit if user configured CPU limit for this pod.

Memory Usage

Total memory usage in bytes.

Memory Working Set

Total working set usage. Working set is the memory being used and not easily dropped by the kernel.

Memory Rss

RSS memory usage.

Memory Request

Memory request (the guaranteed amount of resources) in bytes.

Memory Limit

Memory hard limit in bytes.

Memory Page Faults

Number of page faults.

Memory Major Page Faults

Number of major page faults.

Memory Page Faults Rate

Number of page faults per second.

Memory Major Page Faults Rate

Number of major page faults per second.

Memory Utilization

Percentage of Memory usage / Memory limit if user configured Memory limit for this pod.

Network Send

Total send bytes.

Network Receive

Total receive bytes.

Network Send Rate

Total send bytes per second.

Network Receive Rate

Total receive bytes per second.

Network Send Errors

Total send errors count.

Network Receive Errors

Total receive errors count.

Network Send Errors Rate

Total send errors count per second.

Network Receive Errors Rate

Total receive errors count per second.

Network Transfer

Total send and receive bytes.

Network Transfer Rate

Total send and receive bytes per second.

Verwandte Dokumente

The document was helpful.

Bewertung auswählen

I easily found the information I needed.

Bewertung auswählen