Setting the vSwitchCollector properties
A vSwitch collector is a component that captures metrics from virtual switches on the monitoring system. The vSwitchCollector properties instruct the VMware Performance Agent which virtual switches to monitor.
|
1 |
Locate the VMware Performance Agent’s vSwitchCollector properties. |
|
2 |
Set the vSwitchCollector properties as follows: |
|
• |
Monitoring Switches: Select a list in which you want to specify the VMware virtual switches that you want to monitor. You can select or clone an existing list, and edit it, as required. The default list is monitoredSwitchList. Lists can be shared between multiple agent instances. For more information about list properties, see the Administration and Configuration Help. |
|
• |
DVS Managed Object Reference: The managed object reference of the distributed virtual switch. |
|
• |
Other Switches (Non-VMware): Select a list in which you want to specify the non-VMware virtual switches that you want to monitor. You can select or clone an existing list, and edit it, as required. The default list is monitoredSwitchList. Lists can be shared between multiple agent instances. For more information about list properties, see the Administration and Configuration Help. |
|
• |
DVS Managed Object Reference: The managed object reference of the distributed virtual switch. |
|
3 |
Click Save. |
Setting the Duplicate VM List properties
A duplicated virtual machine is a copy or clone of an existing VM in your environment. The Duplicate VM List properties indicate to the VMware Performance Agent which virtual machines are duplicates or clones of the existing VMs.
|
1 |
Locate the VMware Performance Agent’s Duplicate VM List properties. |
|
2 |
Set the Duplicate VM List properties as follows: |
|
• |
Duplicate VM List MOR: Select a list in which you want to specify the duplicated virtual machines. You can select or clone an existing list, and edit it, as required. The default list is duplicateVMListList. Lists can be shared between multiple agent instances. For more information about list properties, see the Administration and Configuration Help. |
|
3 |
Click Save. |
Setting the Black List properties
In some rare cases, the VMware Performance Agent can encounter ESX® hosts and virtual machines for which it cannot collect data. To prevent these problems, the VMware Performance Agent detects these entities, excludes them from data collection, and adds them to the agent black list.
Any metrics associated with these objects are not included in roll up performance metrics. When an entity is added to the agent black list, an agent message and alarm are generated makes you aware of the problem so that you can investigate it further in the monitored VMware® environment. When the issue with the entity is resolved, it can be removed from the agent black list. The next available performance collection includes this entity in the data collection request.
Each ESX host or virtual machine entry in the user black list should include the Managed Object Reference (MOR) value. The MOR value is assigned to monitored objects in the monitored VMware environment and is collected by VMware Monitoring in Foglight for Storage Management. This value is stored in the Managed Object Reference property of ESX host and virtual machine objects. You can use the Data Browser to find out the MOR values for those ESX hosts or virtual machines that you want to exclude from data collection.
|
1 |
Locate the VMware Performance Agent’s BlackList properties. |
|
a |
Choose the user black list that you want to use for this agent instance. Click the User BlackListed MORs list, and select the black list. The default list is userBlackList. |
|
b |
|
c |
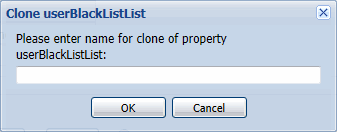
In the Clone userBlackList dialog box, type the name of the user black list. It is recommended to use a syntax that makes the list name unique and easily associated with this agent instance. For example: <list_name>_<agent_name> |
|
d |
|
a |
|
• |
host: Indicates that the black list item is an ESX host. |
|
• |
vm: Indicates that the black list item is a virtual machine. |
|
• |
MOR: The value of the Managed Object Reference property of the ESX host or virtual machine that you want to exclude from data collection. |
|
c |
|
4 |
Click Save. |
Setting the Data Collection Scheduler properties
|
1 |
Locate the VMware Performance Agent’s Data Collection Scheduler properties. |
|
2 |
Set the Data Collection Scheduler properties as follows: |
|
• |
Collector Name: The name of the collector. A collector is a component that captures specific type of metrics. Existing collectors are: Relationship And Hierarchy Data, Inventory Entity Properties, Performance Metrics, and Events Collection. |
|
• |
Default Collection Interval: Contains the length of the default collection interval. The default collection intervals for the existing collectors are: |
|
• |
Time Unit: Contains the time unit for measuring the default collection interval: milliseconds, seconds, minutes, hours, or days. |
|
• |
Fast-Mode Collection Interval: Contains the length of the collection interval when the agent is running in fast mode. |
|
• |
Fast-Mode Time Unit: Contains the length of the collection interval when the agent is running in fast mode. |
|
• |
Fast-Mode Max Count: Contains the maximum count of entries when the agent is running in fast mode. |


