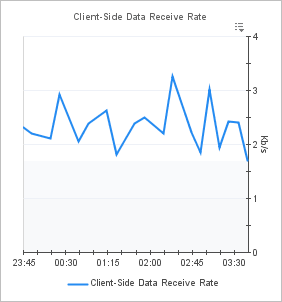
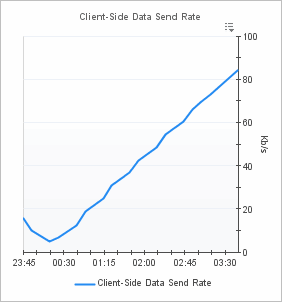
Monitor tab (host data)
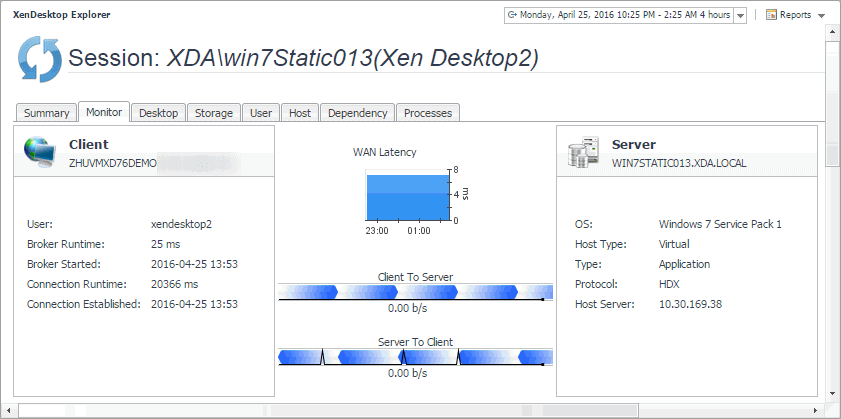
The Monitor tab visualizes the main components in the selected session and their connectivity. This can help you understand the effect of these components may have on your system. These metrics are typically collected by NetScaler agents. However, if NetScaler data is not available, you can collect session metrics directly from the host, if you selected the Collect Session metrics when NetScaler data not available option in the XenDesktop Discovery Wizard. For more information about the XenDesktop Discovery Wizard, see Discovering XenDesktop sites .
When you collect session metrics directly from the host, the Monitor tab can help you understand how well the monitored system responds to client requests in a selected session. It also provides some basic session information, such as the session name, state, catalog name, logon duration, support type, and the delivery group to which it belongs.
|
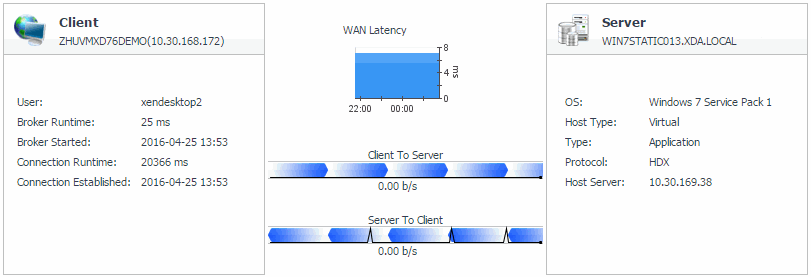
Client: This embedded view shows the name and IP address of the machine accessing your XenDesktop environment. It also displays the following information:
| |||||||||||
|
WAN Latency: This embedded view shows the WAN latency rates over the selected time period and the data transfer rates between the client and the server in each direction, for the selected session. | |||||||||||
|
Server: This embedded view shows the name and IP address of the XenDesktop server machine hosting the application or desktop associated with the selected session. It also displays the following information:
|
Desktop tab
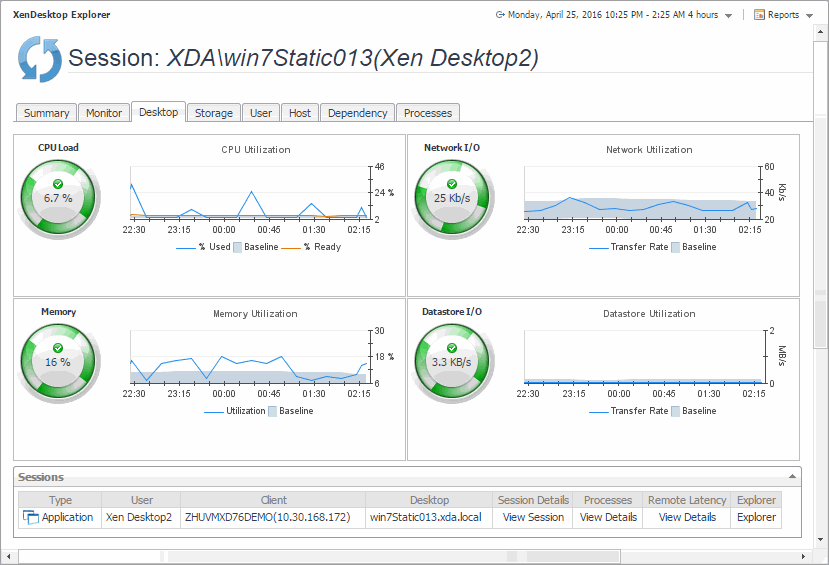
In your monitored environment, a Desktop component encapsulates a Windows® desktop together with application elements that are delivered to end-users on demand. You can review the performance of individual desktops on the Desktop tab. This tab shows the usage of system resources for the desktop associated with the selected session. Use it to see the trends in usage of the selected component’s system resources, and to review any generated alarms, if they exist. For example, high peaks in the memory utilization chart, that drastically exceed historical values could result in performance degradation and should be investigated.
|
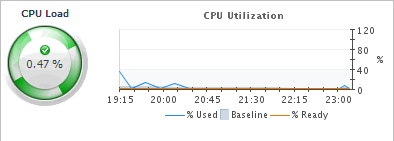
The CPU Load spinner indicates the current percentage of the selected virtual machine’s CPU load, used to execute system code and user programs, based on the total CPU capacity. The % Used line in the CPU Utilization chart shows the percentage of the CPU utilization used by the virtual machine to execute system code and user programs, during the selected time period. % Ready displays the percentage of the virtual machine’s CPU resources that are ready to execute system code and user programs during the selected time period. The Baseline area in the chart indicates the expected CPU utilization range based on historical data. | |
|
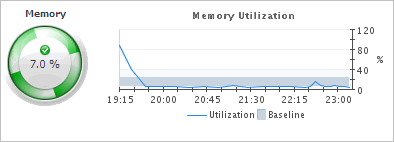
The Memory spinner indicates the current percentage of the average memory usage by the selected virtual machine, based on the total memory capacity. The Utilization line in the Memory Utilization chart shows the percentage of memory used by the virtual machine during the selected time period. The Baseline area in the chart indicates the expected memory utilization range based on historical data. | |
|
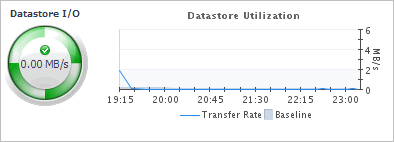
The Datastore I/O spinner indicating the current datastore I/O rate the selected virtual machine utilizes, based on the total datastore capacity. The Transfer Rate line in the Datastore Utilization chart shows the rate at which the virtual machine reads and writes data to the datastore during the selected time period. The Baseline area in the chart indicates the expected datastore utilization range based on historical data. | |
|
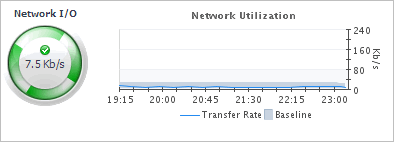
The Network I/O spinner indicates the current rate at which the selected virtual machine transfers data from and to the network. The Transfer Rate line in the Network Utilization chart shows the rate at which the selected virtual machine receives and sends data to the network during the selected time period. The Baseline area in the chart indicates the expected network utilization range based on historical data. | |
Storage tab
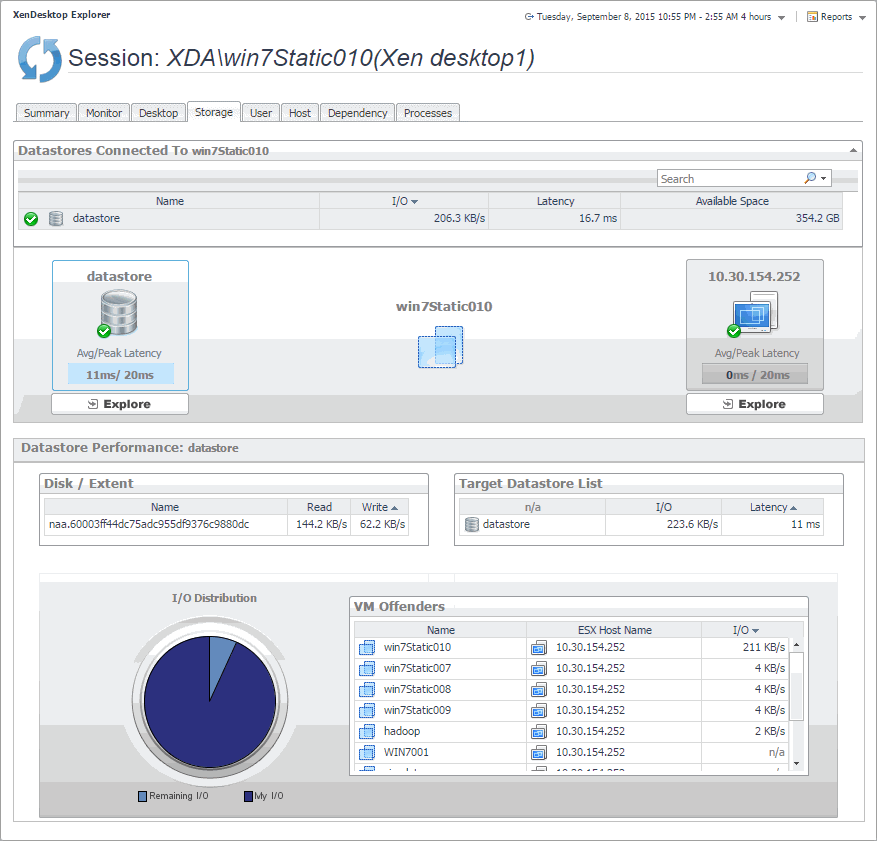
The Storage tab displays a combination of embedded views illustrating the storage capacity available to the datastores associated with the selected session. It identifies the datastores associated with the selected virtual machine and shows performance metrics associated with each datastore.
User tab
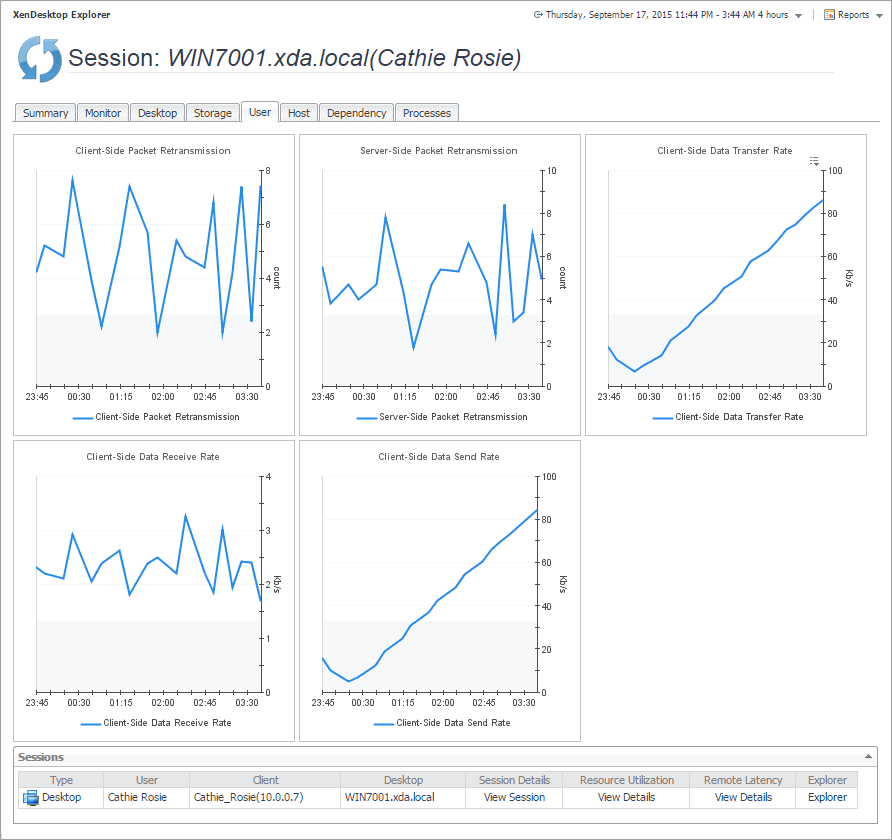
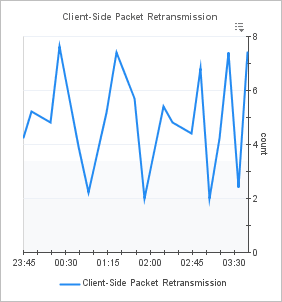
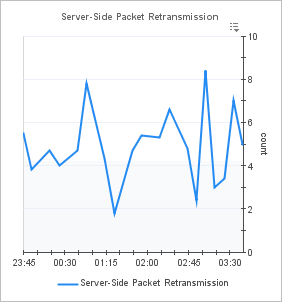
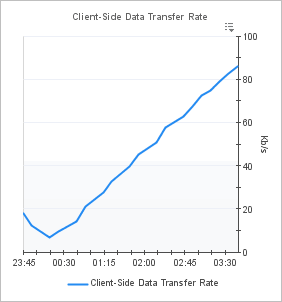
The User tab displays set of graphs that illustrate the rates of the selected session's data packet retransmission and transfer rates on the client and server side. In general, consistently high values in the graphs may indicates the signs of potential bottlenecks and should be investigated.

