-
Titel
How to monitor and detect SQL Server round-trip performance issues using custom designed metrics -
Lösung
For every query issued by the application, time is needed to reach the SQL Server and then the time needed for results to get back to the application. As all communication between an application and SQL Server goes via some network (LAN or WAN), network performance could be a critical factor affecting overall performance. Two factors affect network performance: latency and throughput.
The latency or so-called SQL Server round-trip time (RTT) is something that is often overlooked by DBAs and database developers, but excessive round-trip time can severely affect performance. However, to be able to understand why and how the round trip affects the SQL Server performance, as first, it is vital to understand the SQL protocol itself.
A talkative SQL protocol
SQL protocol is designed to rely on intensive communication between the client and SQL Server. It as a very talkative protocol where the client can create a series of requests to the database, each request must wait for the response on the previous one before it can be sent.
Since applications tend to handle their data in a way that minimizes the data volume transferred in each interaction with the database, the result is usually that a significant number of requests/responses are needed for dealing with even modest data requests. In other words, an application that interacts with SQL Server is often forced to spend excessive time in waiting for handling all requests/responses duos on the network.
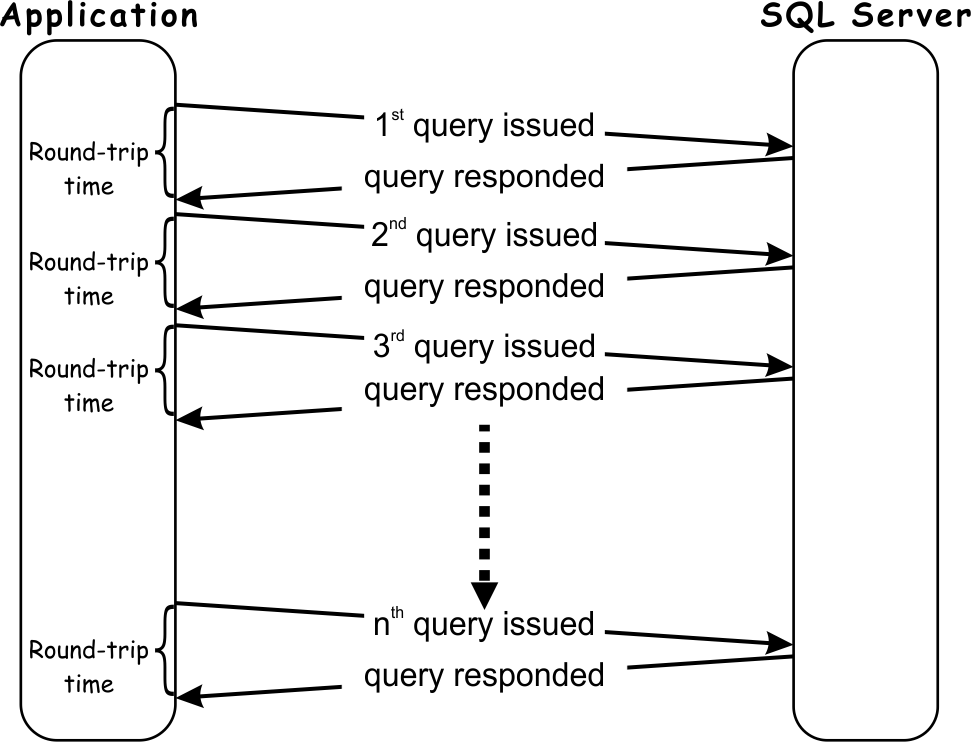
Looking at the diagram above it is clear that even in an ideal scenario, where SQL Server query processing time is zero, the application must wait for at least a sum of SQL Server round-trip times for each query execution. What’s more, in a situation where a single query has to return a substantial amount of data, more than one round-trip could be experienced for that query, which depends on the network TCP protocol. The number of round-trips in such case can increase exponentially causing an additional increase of the total round-trip time.
The most obvious scenario where inefficiency relating to the SQL protocol is the most noticeable is update statements. Even when a single update SQL query is issued, the application must wait a minimum of one round-trip time for each row updated in the target table.
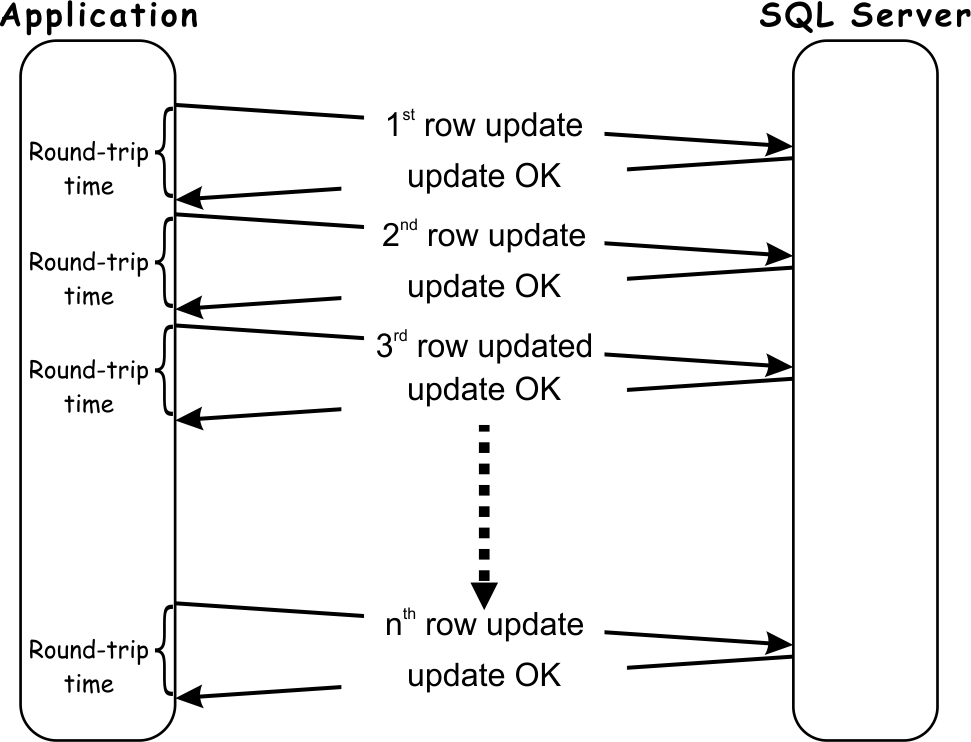
The more data that has to be updated; the longer time application must wait on the round-trips.
It is now clear that application performance does not depend strictly and always on SQL Server, so let's expand this a bit to get a better insight into scenarios when the high round-trip times could affect the application performance.
When developing the application, developers usually work in a controlled environment with high-end machines and with the whole development environment is on the same machine as SQL Server, and thus close-to-zero delay in communication with a database. So after the development completes, the application has to be deployed in the customer environment; and this is where the problem starts.
Depending on the type of the application, it can be deployed in the LAN (Local Area Network), WAN (Wide Area Network) or combined LAN-WAN environment
It can often be heard from developers that the application should use LAN or WAN connection with high throughput to get satisfactory performance. However, it is not unusual that the application users start to complain that instead of getting results immediately or in a few seconds they have to wait tens of seconds or even minutes to get results. The problem here is that SQL Server applications are not throughput based, but transaction based, meaning that it does not move a significant amount of data in a single transaction, but rather small chunks of data in numerous transactions. So for a SQL Server application, the network round-trip (latency) time is often more critical for performance, than network throughput.
Various network round-trip times:
LAN < 5 ms WAN 20 – 450 ms Mobile 3G 100-500 ms Mobile 4G < 100 ms With these network round-trip times, an impact on the application performance for a transaction that requires 500 round-trips can be calculated. For the calculation, some typical round-trip times were used:
LAN 500 x 3 ms=1,500 ms WAN 500 x 100 ms = 50,000 ms Mobile 3G 500 x 200 ms = 100,000 ms Mobile 4G 500 x 80 ms = 40,000 ms So the difference and impact on performance are noticeable. For application deployed in a LAN total network round-trip is 1.5 seconds, while when deployed in a WAN total round-trip is 50 seconds.
So now it is evident that monitoring the round-trip is an essential performance parameter, especially in today modern environments that are often deployed in a WAN environment, either by deploying SQL Servers in the cloud or by using the web or mobile based applications.
Monitoring the round-trip time - Ping
Using the system ping utility is the easiest way to measure network round-trip between two machines. The ping measures round-trip time (latency) for transferring data to another machine plus the transferring data from that machine back to the first machine. Below is an example of measuring ping between the machines, where destination machine is deployed to a WAN and connection between machines is established using VPN.
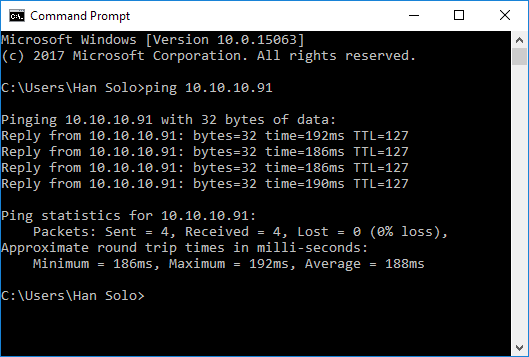
So in this particular case, an average round-trip is 188 ms, which is not a particularly good result.
However, ping results are typical network related results, and for DBAs, it is more important to measure. For them, measuring round-trip time considers how long it takes to the database to respond to a single application request. In this case, using ping is not the best choice, but it still can be the first choice for initial troubleshooting.
Monitoring the round-trip time – SQL Server Profiler
SQL Server Profiler is a handy tool for that can provide much information about the SQL Server, and that includes the ability to track round-trip times. The most important events for measuring the round-trip are SQL:BatchCompleted and RPC:Completed events. However, Profiler can be invasive and when used is sometimes the reason for degradation of SQL Server performance on a highly active server. It is often a choice for a quick troubleshooting, but not a long-term choice for monitoring the round-trip and collecting the historical data.
There are some other custom build options for measuring the round-trip time, but many if not most of those require a significant investment of knowledge, time and energy and is often out of reach for new or less experienced database administrators.
So, this is precisely where third-party tools like ApexSQL Monitor can be found useful for database administrators of any experience level.
Monitoring the round-trip time with ApexSQL Monitor
While ApexSQL Monitor displays a wide range of the typical SQL Server and Operating System performance metrics, it also has the ability to add further custom SQL performance counters that can be used for some specific to system on-demand monitoring, historical trending, and alert. Some pre-configured custom counters that can be useful in various environments are available in the Using custom SQL performance counters to monitor SQL Server article.
To access the Custom metric page:
-
Select SQL Server in the server list in the left pane
-
Press the Configure link in the main menu, and then the Custom metrics link in the sub-menu
-
Press the Add button to open the Add custom metric page
-
Insert the name for the metric in the Name field ( e.g. “Round-trip time”) and add description if necessary
-
Select SQL Server performance from the Category drop-down menu

-
In the Unit field type ms, as the value returns in milliseconds
-
Now set the Metric return type by selecting the Execution time radio button. It is the specific functionality of this feature as it measures the time (in milliseconds) it takes to execute the custom query. It is a useful custom SQL counter type when there is a need for testing the behavior of a query during different periods of the day or week
-
In the Period field, insert a period in seconds between two consecutive executions of the custom metric. The period determines the frequency of the custom query execution, e.g., how often the performance data collected from the target instance. A suggested value might be 1800 or 3600 seconds, but this is solely on the DBA’s preferences and what level of precision is needed. Setting up lower value does not affect the target server performance at all as the query that is used for this metric is very lightweight
Now in the Query text filed, type the following query:
SELECT 1Yes, this is the simple query, and here is the quick explanation why this particular query is used for this metric.
SELECT 1 when executed, just returns 1. Since this is just a constant, the query just returns that constant. Moreover, considering that it is a constant the query is very fast, consuming almost no SQL Server time. Thanks to this, once the metric returns the execution time, that time is practically the round-trip time as time used for query execution on SQL Server is negligible.
Once the custom metric parameters are filled, it should look like this:

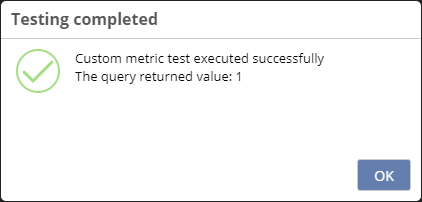
Now, before proceeding and saving a new custom metric, use the test button to check whether the user query can be executed successfully on the target machine. To do that, press the Test button, and if everything is OK, the following info should be displayed:
ApexSQL Monitor allows trigger alerts for the newly created custom metrics. When the Trigger alerts checkbox is checked, it configuring alerts is enabled to be triggered depending on the value that the metric returns.
Thresholds option enables configuring the three threshold values: low, medium, and high. Each alert severity is displayed in different status color. The value should be set depending on the type of network the monitored SQL Server uses. Some recommended threshold settings would be:
Low Medium High LAN 5 7 10 WAN 50 100 150 Mobile 4G 30 50 80 These are just recommendations to be used as the starting point, but thresholds could significantly depend on the state of the network used so those values might need adjustments by the end user.
The Trigger alerts for values above defined threshold radio button should be selected here. This option is self-explainable it means that the expected value is “bad” when it higher than normal.
Set the appropriate Alert period value, for avoiding excessive alerts for this metric. Once the user sets the value (in seconds) the alert can be triggered just in a particular situation when all measured values returned during the specified period have exceeded the defined threshold value. By carefully setting the alert period, excessive and/or false-positive alerts can be mitigated. The suggested value is between 30 and 60 seconds in LAN environments, and 60 to 120 seconds in WAN environments, but this could vary based on preferences, environments, etc.
So, after everything is set, press the Save button to create the new custom metric.
Once created, the metric appears everywhere like any other built-in metric, including the configuration page. In this particular case, it appears in the SQL Server configuration metric group.
By default, the newly created metric is not selected for monitoring. To start using the Round-trip time metric, enable it in the configuration page for the particular server and/or group. From here the user can change any of the available settings for this metric, including the ability to calculate baselines.
Once the metric starts to collect the performance data, its chart shows the collected values.

In this particular case, the WAN-based via VPN for connection to SQL Server is used and some quite high Round-trip times indicate a potential performance problem.
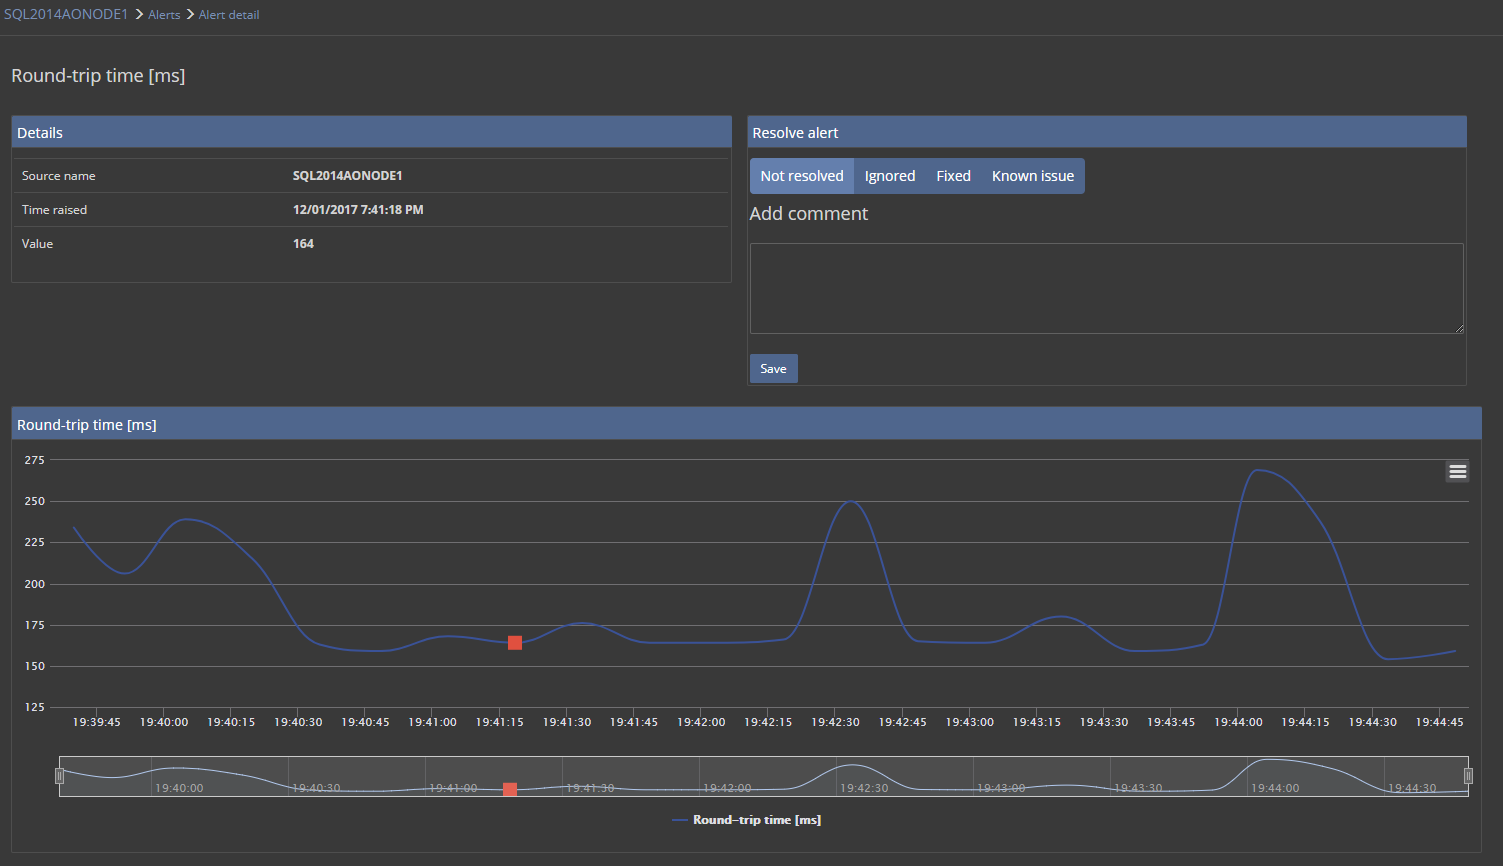
Once an alert is raised for Round-trip time metric, it can be reviewed as any other alert.
To get more details about the alert, just click on the metric name link that displays page with full details about that particular alert.
-


