Applies to
ApexSQL Monitor
Summary
This article provides information about the best practices for ApexSQL Monitor installation, configuration, and usage for the most optimal performance monitoring, application performance and minimal overhead on monitored servers.
Engineered in a way that allows easy and straightforward installation and usage, ApexSQL Monitor can be configured and used out of the box with minimal or little or no manual intervention. Such an approach allows ApexSQL Monitor to be set up quickly and easily even by users with low or no experience in SQL Server performance monitoring.
However, advanced and experienced users, as well as users who are in charge of maintaining a large number of SQL Server instances, might want to fine tune ApexSQL Monitor to get the most of the application while keeping the necessary hardware resources to a minimum. In that way, finding the right balance between the required performance monitoring precision and optimal application performance for ApexSQL Monitor. We suggest you consider the following best practices suggestions to achieve that end.
Installing on a remote dedicated server
For better understanding the ApexSQL monitor architecture and working principles, it is advised to read the ApexSQL Monitor installation terms, definitions, and network topography article to properly understand ApexSQL Monitor design, its components and relation between those, and how the application is working in the background.
There are two approaches to install ApexSQL Monitor on a remote dedicated server: Installing the application on a dedicated remote physical machine or a dedicated remote virtual machine.
|
Quick tip: Installing ApexSQL Monitor directly on a production server is not recommended, in general, and under certain circumstances can cause significant overhead and performance degradation of the server in question |
Pross and cons of using a dedicated physical machine to host ApexSQL Monitor:
Pros:
Cons:
Pross and cons of using a dedicated virtual machine to host ApexSQL Monitor:
Pros:
Cons:
Using a domain Windows account with appropriate privileges for ApexSQL Monitor service
During the installation process, one of the actions required from the user is to enter the appropriate Windows user and credentials that the ApexSQL Monitor service uses. The best approach is to use a domain user that have sufficient privileges on all instances that are in plans for monitoring. More information about the required privileges can be found in ApexSQL Monitor – Permissions and requirements.
|
Quick tip: ApexSQL Monitor does have the ability to connect to monitored servers using a windows account that is different from the service account. It accomplishes this via the ability to use impersonation, so users who cannot apply this approach can still use the application without any restrictions |
The advance of such an approach is that ApexSQL Monitor is not forcing user impersonation for connecting to the monitored instance and thus avoids the additional use of resources. Such an approach is particularly important for users that monitor a large number of instances as this relieves the ApexSQL Monitor service from being forced to perform impersonation whenever connects to the monitored instance to collect the performance data.
An additional benefit for users that have to monitor a large number of instances is that they do not have to enter any credentials when adding the instances for monitoring. Leaving the User and Password fields empty on the Add server page, allows the ApexSQL Monitor service to use its own account for establishing a connection.
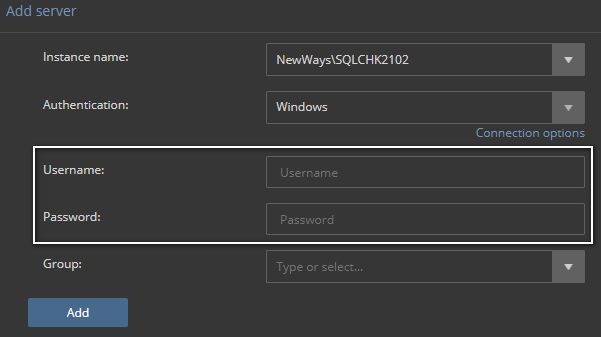
|
Quick tip: Explicitly entering the credentials in the Add server page, even those are already used by the ApexSQL Monitor service, forces the service to impose impersonation when connecting to that instance, so leave the fields blank to prevent impersonification |
Change the metrics configuration to meet specific performance monitoring needs (Configuration -> Metrics page)
The ApexSQL Monitor default monitoring configuration ensures higher monitoring precision and thus better insight into the state of the monitored instances during the initial monitoring period, but at the same time, it makes it easier to evaluate application during the trial period. However, such approach has its disadvantages, especially for more experienced users and users with a higher number of monitored instances, as the volume of collected data could be quite high. Finally, requirements for additional storage resources can significantly exceed the planned capacity.
To alleviate or even prevent such problems entirely, decreasing the frequency of metrics reading by increasing the value of the Period column reduces the volume of collected performance data. For more information on how to introduce the necessary changes, check How to configure ApexSQL Monitor.
Recommended values for the various metrics group depending on the number of monitored instances:
System performance metrics:
SQL Server metrics:
Database metrics:
Index metrics:
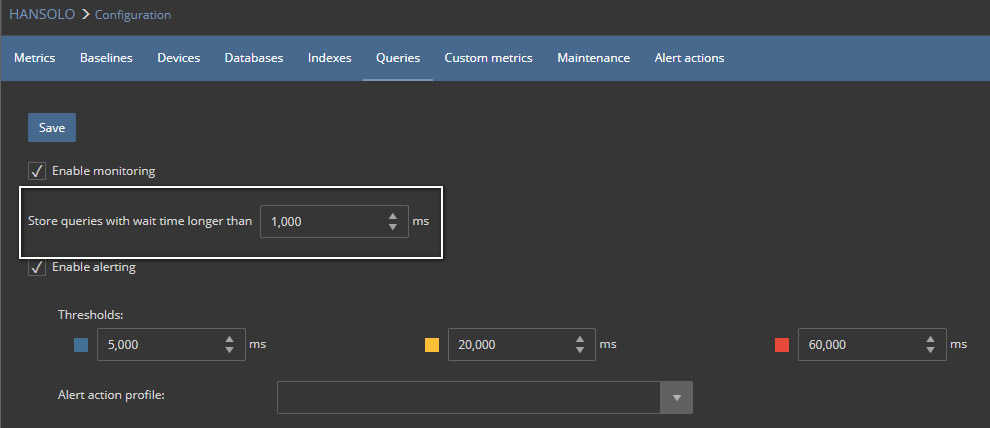
Change the query waits configuration (Configuration -> Queries page)
Query wait monitoring is enabled by default, and ApexSQL Monitor collects and stores any query in which the wait time is longer than 1 second. Such low default criteria are recommended for the first week or two of monitoring as the data collected in this way allows a user to identify what kind of queries are potentially causing the problem and what are the query issues that the user has to deal with.
However, such settings can, under some circumstances, cause excessive query data collection. It is important to know that ApexSQL Monitor, with each query that meets specified monitoring criteria, collects and stores not only the information about the wait types and wait times, but also the full T-SQL of the executed query as well as the belonging execution plan. Both the T-SQL script and the execution plan could be quite a large. Having in mind that for medium and highly active SQL Servers the number of executed queries and query executions could be quite high, as a consequence a significant amount of data that have to be transferred, processed and stored could impose additional load not only to network resources but also to storage requirements for the repository database. For less optimized systems where a high number of ad-hoc queries executes regularly, requirements for additional resources multiplies additionally.
As query wait statistics are specific to an instance, and it is not possible to set the recommended values for Query waits configuration. More experienced DBA can easily figure out what value to set here depending on the state of monitored SQL Server.
For less experienced users or users who are still not fully familiar with SQL Servers that they have to maintain, a possible approach would be the following:
For all users, regardless of the number of monitored servers
For users with large number of monitored servers
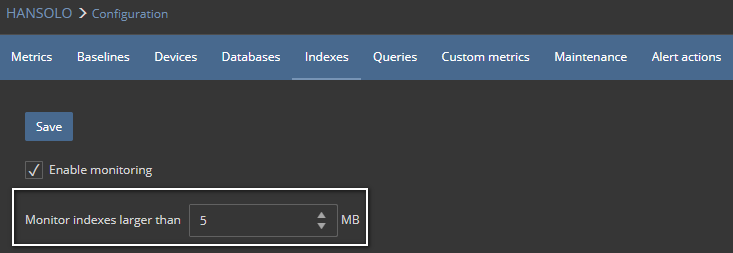
Configuring index monitoring (Configuration -> Indexes page)
Index monitoring is not enabled in ApexSQL Monitor by default. The primary reason for that is that index monitoring is a performance intensive operation that can cause additional overhead on the monitored server and on the ApexSQL Monitor itself in a way that is not always predictable. The overhead depends on multiple factors such as the number of databases, the number of tables per database, the number of indexes per table, the number of indexes total, type of indexes and index structure, the size of indexes and finally the number of servers for which the index monitoring is enabled.
Having all this in mind, enabling and configuring index monitoring should be done cautiously and only when index monitoring is necessary for performance troubleshooting.
When index monitoring is enabled, the application monitors, by default, all indexes larger than 5 MB, which is OK during the evaluation period or for smaller environments and smaller monitored databases.
To index monitor large databases and/or large and highly active servers and environments, where a number of indexes can reach tens and hundreds of millions, it is critical to increasing the size of indexes that should be monitored. Based on some previous experience with such systems, it is highly unlikely that indexes smaller than 100 MB could cause some significant problems, so it is advisable to increase the value in the Monitor indexes larger than to at least 100 MB.
Defaulting to a small value for Monitor indexes larger than, such as default value, for example, does not affect the monitored instance significantly, but it does affect the ApexSQL Monitor user interface and central repository database performance. In addition, ApexSQL Monitor has to deal with a large amount of data processing and then storing in the repository database, but it also has to deal with displaying such an amount of data. All of this results in extensive reading from the repository database and heavy processing of data to display in the user interface. That can cause delays in displaying the performance data and otherwise result in a less responsive user experience.
Having all this in mind, while index monitoring can be a powerful tool for the performance monitoring process, it must be approached carefully and used only when needed. As designed for advanced and more experienced users, improper use and/or configuration of this feature can often cause more problems than benefits so use this feature knowledgeable and with caution.
