
-
Title
The process of elimination: How to analyze SQL Server performance with baselines and wait statistics -
Resolution
Wait statistics = Data
SQL Server’s built in abilities to track query execution via wait statistics is critical to resolving performance problems. Wait statistics or response time analysis are metrics that provide the ability to measure the time needed for the database to respond to executed queries. It doesn’t simply represent the time needed for a query to complete execution, but the wait statistic is also the measurement of the time the query has taken for each step in its execution. That information becomes the basis for identifying bottlenecks that are affecting the execution time.
Wait statistics are generally more precise for performance optimization than CPU, memory usage or what SQL Server health status, in general. By identifying and understanding SQL Server bottlenecks, their source and cause, via wait statistics it is possible to optimize SQL Server to avoid them and to “reroute” queries to a more optimized execution path.
Generally, there is no need for monitoring all SQL Server wait types all the time but focusing on those with the highest wait time collected during the time. The following query will allows getting information about top 20 wait types with the highest wait times
The wait stats data can be obtained from sys.dm_os_wait_stats Dynamic Management View (DMV).

Quick tip:
Wait statistics data are retrieved from SQL Server Dynamic Management Views (DMV), but it must be taken into account that DMVs are dynamic objects and all information that DMVs collect will be flushed with every restart of SQL Server. Data obtained via DMVs might not be representative and reliable samples in situations when SQL Server is frequently restarted so using that data should be done with caution during troubleshooting
The query below uses the sys.dm_os_wait_stats DMV and it will return the top 20 wait types by the highest total wait time
SELECT TOP 20 *
FROM sys.dm_os_wait_stats
WHERE waiting_tasks_count > 0
ORDER BY wait_time_ms DESC
GO
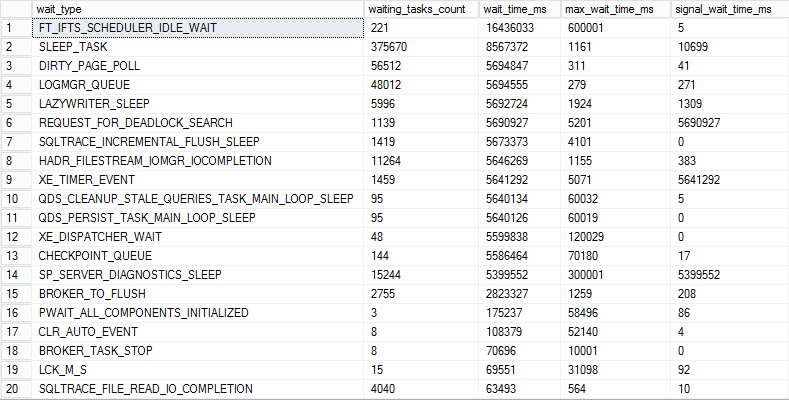
This way we will get the wait stat types with the highest wait time on the server since the last server restart. However, such general information is not always sufficient when it comes to troubleshooting of potential issues as it lacks the necessary context to interpret this data.
Wait statistics + Baselines = Information
To understand and properly interpret the wait statistics for the period of interest, it is important to know what data should be considered as normal, aka the baseline, for a different period of times, especially for some frequent and usual wait types which high values are not unnecessarily indication of an issue (i.e. CXPACKET, SOS_SCHEDULER_YIELD etc.). This additional dimension of time, allows us to transform raw wait statistics into more actionable information.
For example, if the specific wait type has high values every Monday between 2PM and 5PM for the past month or two and the SQL Server was not adversely affected by such high values, that could be considered as normal for that wait type in that time frame. Therefore, it is unlikely that when issue occurs in that time frame again on Monday, that this specific wait type is the cause of the problem. The most effective way to gain an accurate perception of what are the normal values for different wait types during the different periods of time is by establishing a baseline. Baselining wait types data can determine whether the specific wait type data are within the normal boundaries in the specified time period, vs those that are potentially anomalies in that should be further investigated
More information about baselining can be found in the How to detect SQL Server performance issues using baselines – Part 1 – Introduction article and details on how to establish and use baselining can be found in the How to detect SQL Server performance issues using baselines – Part 2 – Collecting metrics and reporting article
Extending and improving on baseline analysis = Decisions
ApexSQL Monitor significantly extends and improves on the concept of baselining, and of custom solutions most DBAs have time to create themselves, by providing a variety of value added features. More details about the ApexSQL Monitor baselining abilities can be found in the How to detect SQL Server performance issues using baselines – Part 3 article
ApexSQL Monitor allows for advanced monitoring capabilities of SQL Server wait types almost immediately after installation.
To start:
- Select the SQL Server instance in the tree view in the left pane
- Select the Wait stats tab
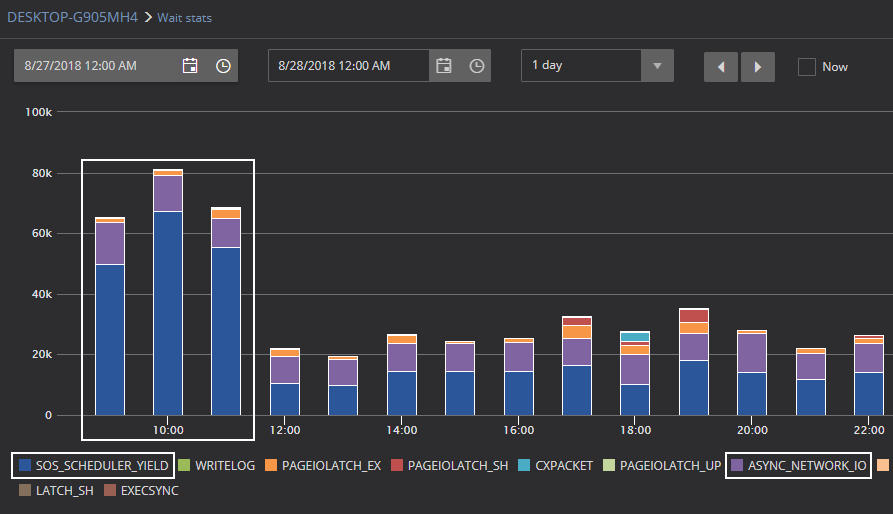
Wait statistics will be displayed in a bar chart as shown in this example for a particular day:
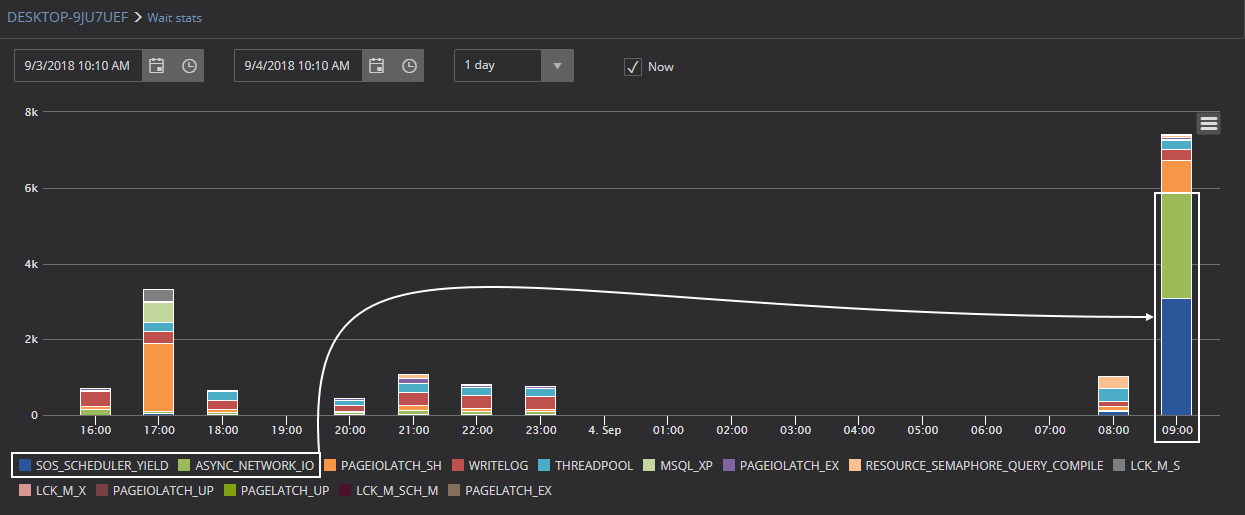
So, as it can be seen from the picture, if the issue is reported between 9 AM and 12 PM, by taking a look at the chart it would be understandable if SOS_SCHEDULER_YIELD and ASYNC_NETWORK_IO wait types were associated with the problem, as their values have spiked significantly in that period comparing to the rest of the day. But then again, maybe not
ApexSQL Monitor collects wait statistic in 30-minute periods, which is generally sufficient precision for locating the potential root causes of performance problems. By collecting data every 30 minutes, ApexSQL Monitor can create precise baselining data for each wait type
By clicking at the Show baseline button, the user can immediately get a better perspective and some crucial details about SQL Server wait types that could look as the cause of the problem
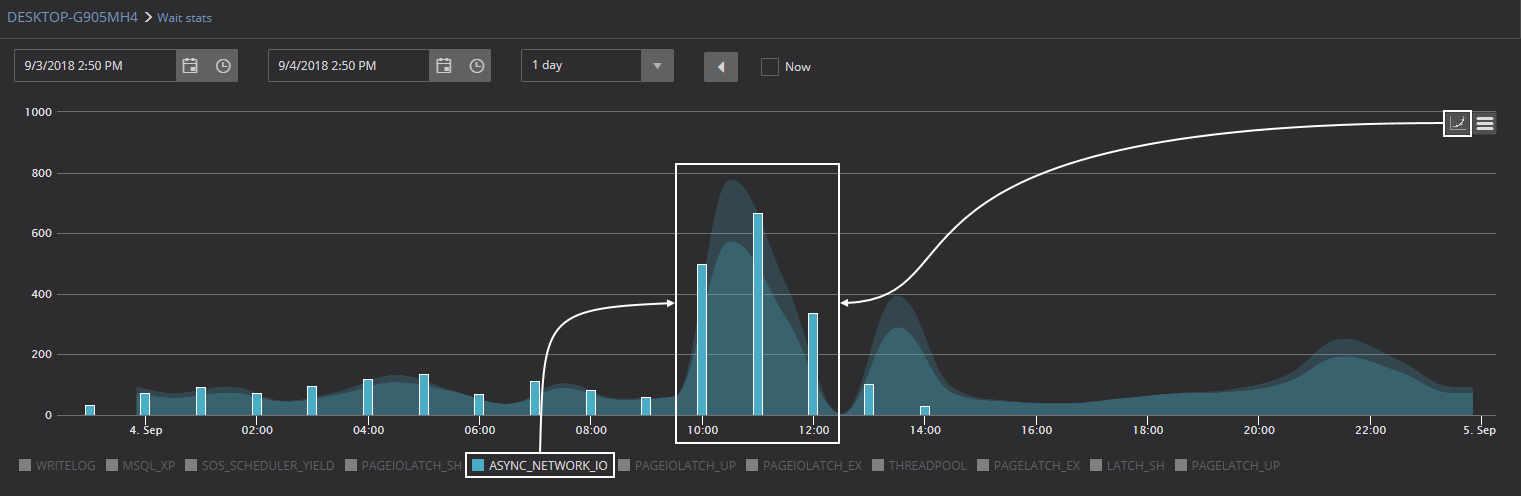
As it can be seen now, the ASYNC_NETWORK_IO wait type values, although “high”, are actually within a normal historic range for that specific period of time. If we want to check the situation with SOS_SCHEDULER_YIELD wait type which is also indicated as the potential problem, just click on that wait type in the legend of the chart:
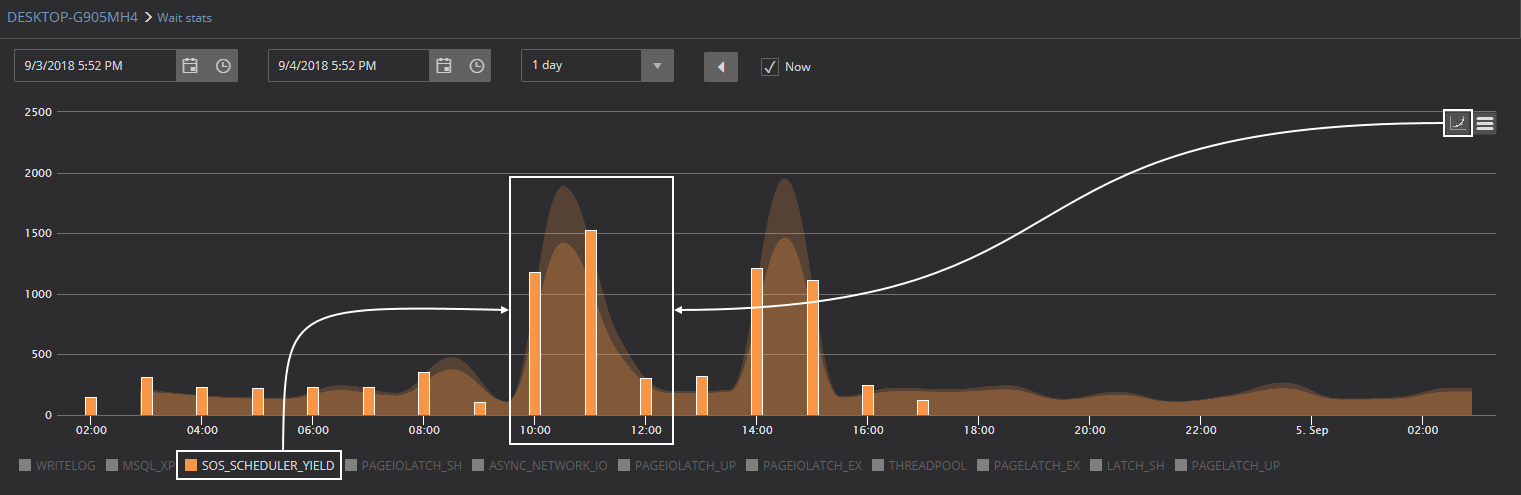
We get similar results with this wait type.
It is now more than apparent that both wait types values are quite normal and expected for that specific part of the day. Those issues can now be eliminated, as potential causes of the reported SQL Server performance problem, allowing the focus to be put on something else, in an attempt to isolate the true cause
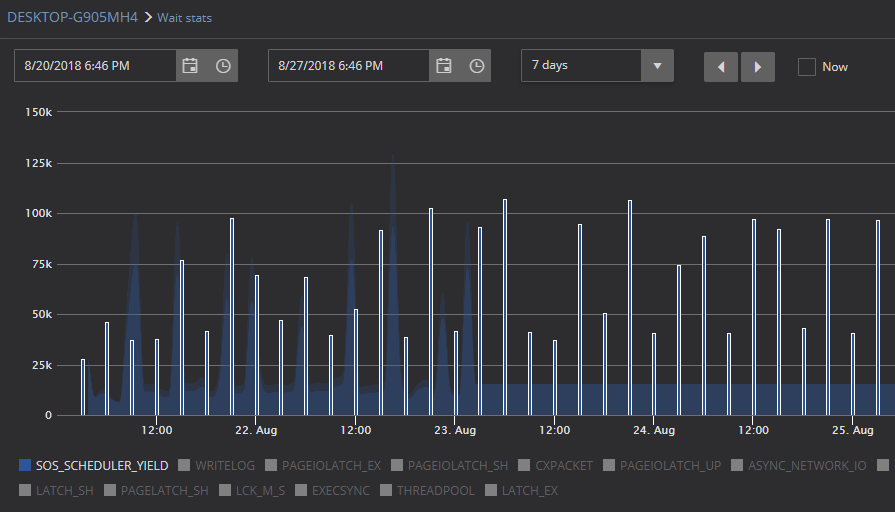
For a quick check, it is quite easy to review the values on the same day, in the previous week, when no issues were reported, to get some context. By selecting the date, in this case the previous Monday, wait statistic for that particular day, can be analyzed as a point of reference
As it can be seen, in the specified period of time of interest, both SOS_SCHEDULER_YIELD and ASYNC_NETWORK_IO values were also quite high, similar to values in the current period when the performance problem is being encountered. By quickly checking the baseline for that period it can be verified that values of the two wait types are also not anomalies
Additional resources: