-
Title
How to perform health checks on SQL Server instances with ApexSQL Manage -
Description
This article describes how to run a health check in ApexSQL Manage. -
Resolution
One of the most important parts of database administration is knowing the state of SQL Server instances. Instance optimization and regular health checks are a time-consuming task that can be made easier using the SQL manage instance tool.
Before starting a full SQL Server instance optimization, a SQL Server instance needs to be added. This process is pretty straightforward, and detailed information on this subject can be found in How to discover SQL Server instances, SSRS, SSAS and SSIS services across the network article.
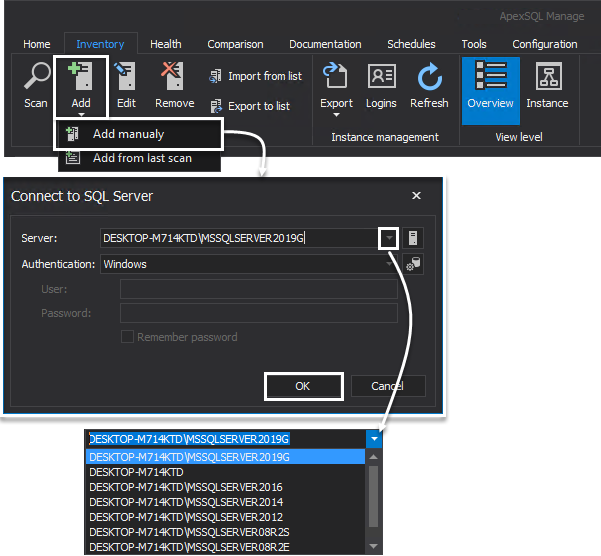
For the purpose of this article, SQL Server 2019 GA will be used, and it will be connected manually. This can be done in the Inventory tab, under the Add option by clicking on the Add manually button.
On the Connect to SQL Server window, add a SQL Server from the Server drop-down list. Choose a SQL instance and select the Windows authentication method under the Authentication drop-down list.
Click the OK button to proceed to the next step:
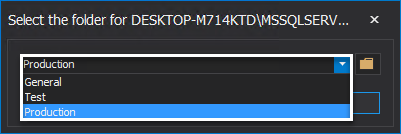
For easier management, a folder can be chosen where to add the SQL Server instance. By default, there are three built-in folders:
- General
- Test
- Production
In our case, the SQL Server will be added to the built-in Production folder:
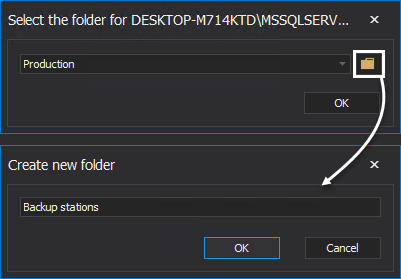
Additional custom folders that will address specific user environments and scenarios can be created. By clicking the folder button, the Create new folder window will appear, in the box enter a name for a folder and click the OK button:
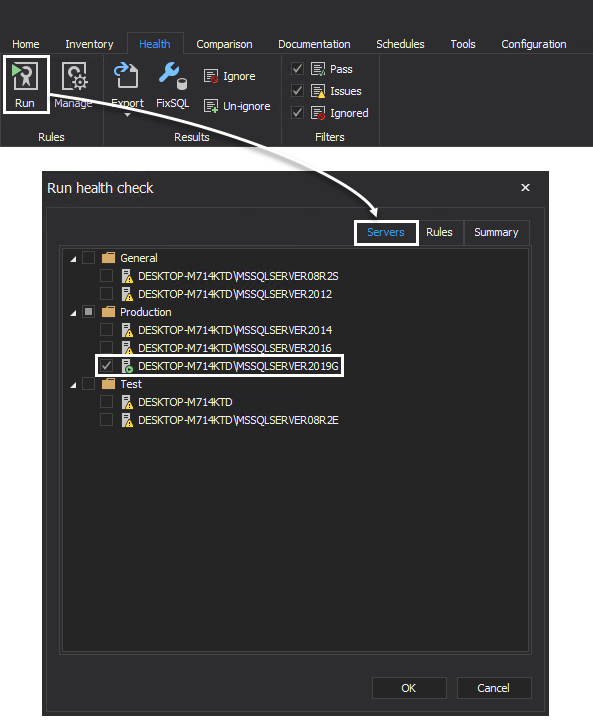
Once the desired SQL Server is added in the SQL manage instance tool, go to the Health tab and run a health check. Click the Run button, and in the Run health check window under the Servers tab specify on which SQL Server instance to run the performance analysis:
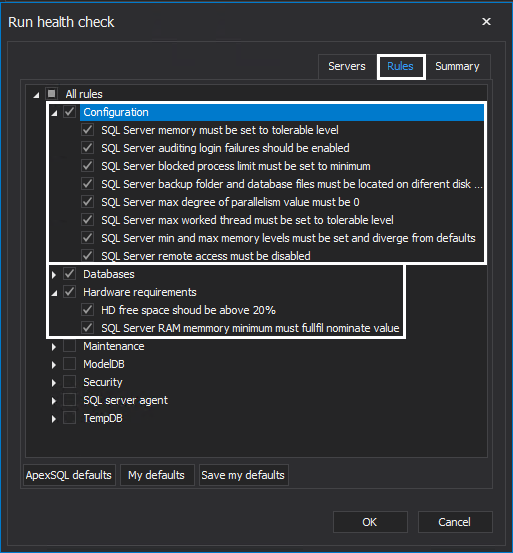
Rules in ApexSQL Manage are divided into several categories which serve to ease SQL Server health check processes and target specific areas for analysis:
- Configuration – Rules for checking issues relating to SQL Server configuration
- Databases – Rules for checking issues relating to the database configuration
- Hardware requirements – Rules for checking issues relating to hardware requirements that are needed for optimum performance
- Maintenance – Rules relating to database backup routine and valid logins in Active Directory
- ModelDB – Rules for checking ModelDB configuration
- Security – Rules relating to SQL Server security and potential issues
- SQL server agent – Rules relating SQL Server agent security
- TempDB – Rules relating to TempDB configuration
All rules are located under the Rules tab of the Run health check window:

Quick tip:
Default rules cannot be changed or deleted.
This option is only applicable to custom written rules.
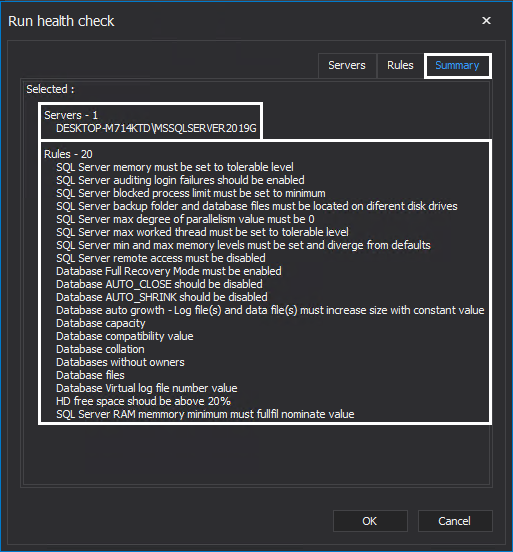
In the Summary tab, an overview of the SQL Server and rules selection are shown:
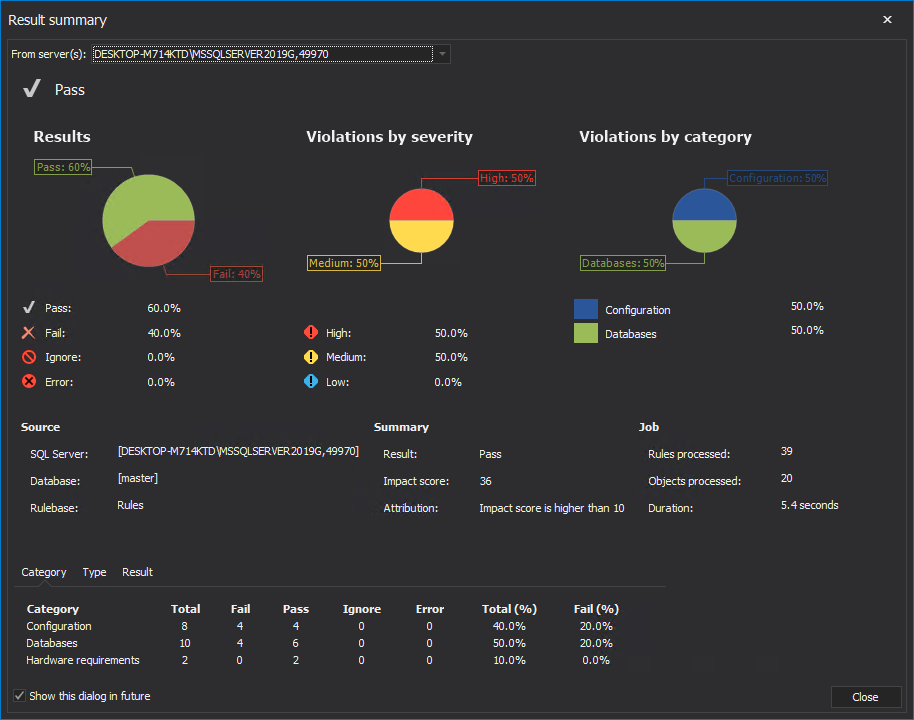
Upon executing the rules, the Result summary window will be shown, where statistical information regarding health check analysis can be found:
Since SQL Server is added to the Production folder, selecting just the folder will show grid results for all SQL Server located in the folder, given that a health check has previously been performed on said instances.
Selecting just the SQL Server in a folder will only show grid results relating to that SQL Server.
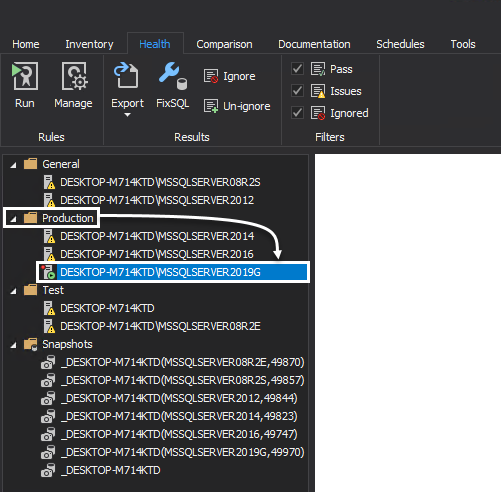
Additionally, after running a health check, the server icon now has a red dot in the left upper corner, which is indicating that some issues were detected with this instance:

Rule results grid
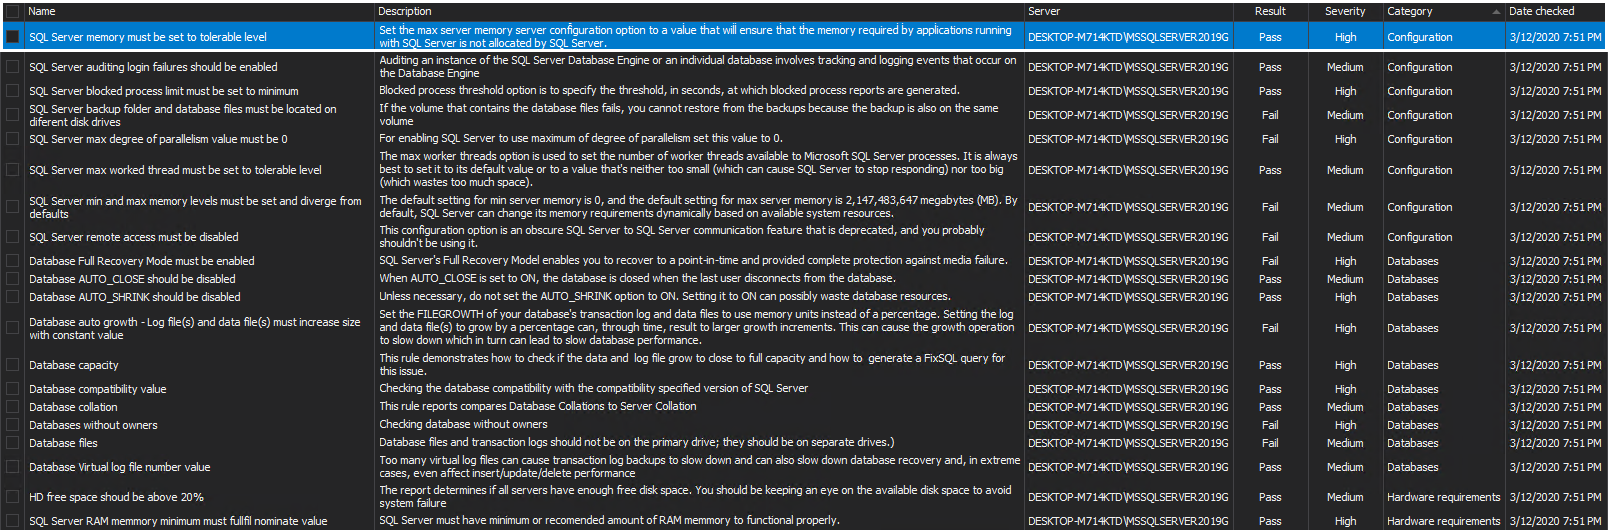
Upon performing an instance health check, the SQL manage instance tool shows results in the form of a grid, where a list of all the previously selected rules and detailed information for each of them is shown.
Result grid is divided into several columns:
- Name – Rule name
- Description – Rule description
- Server – Server name
- Result – Result of the executed rule which can be Pass, Fail or Error
- Severity – Rule severity determined by best practices
- Category – Category to which the rule applies to
- Date checked – Date when the rule was executed
Detailed information regarding executed rules is divided into 5 tabs:
- Result
- Description
- Violation
- FixSQL
- Message
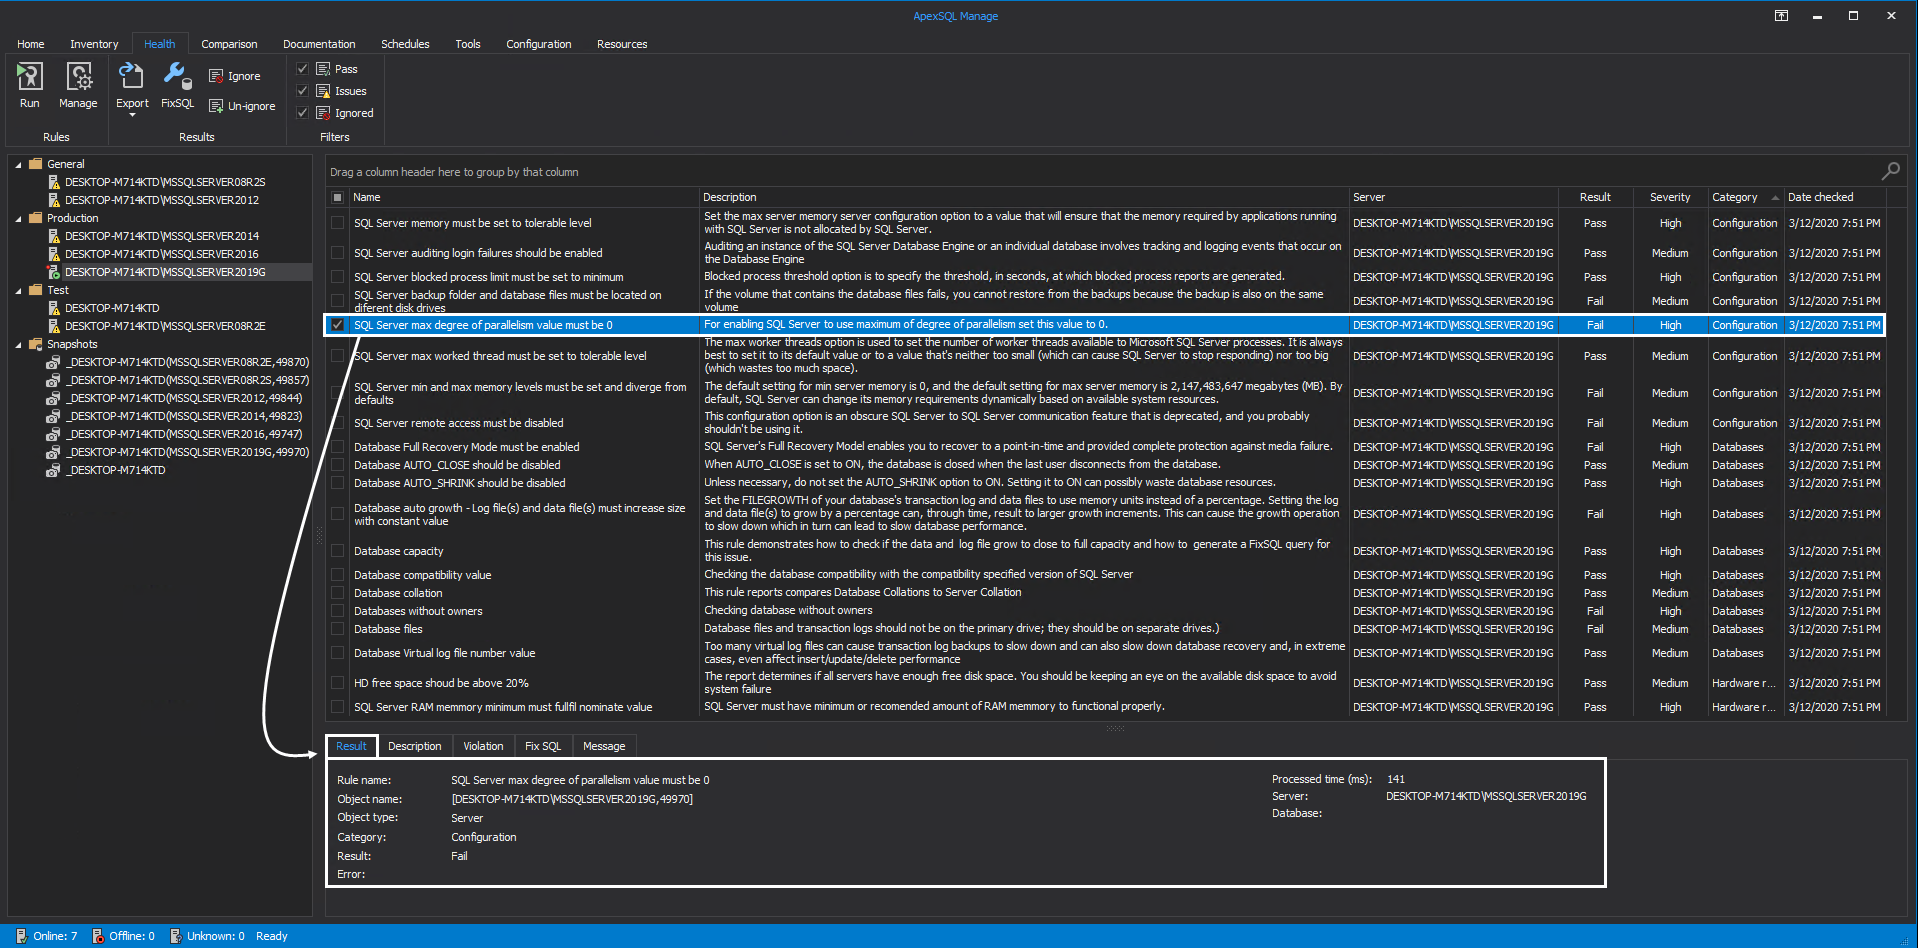
Detailed information regarding failed rules are divided into tabs and shown in the example below:
Result tab shows information regarding the rule we executed.
Key points here are:
- Rule name – Name of the selected rule
- Server – SQL Server on which the rule has been executed
- Category – Which category the rule belongs to
- Result – Result can be Pass, Fail of Error
- Error – When a rule can’t be executed an error message will be shown with details regarding the nature of the error
- Process time – Time needed for the rule check
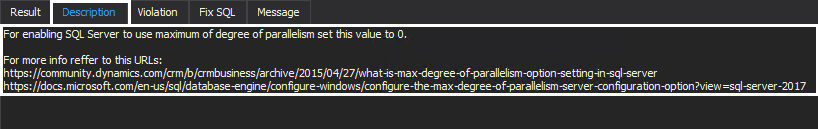
The Description tab shows detailed information regarding the selected rule. Additionally, some rules have external links leading to official Microsoft websites for further information on the subject related to the selected rule:
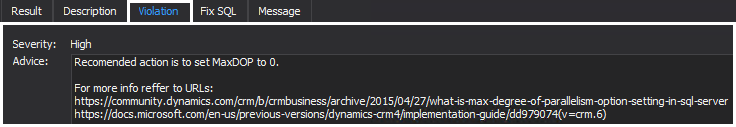
The Violation tab shows the Severity and Advice. The Severity level for default rules cannot be changed. The Advice message contains recommended actions and external links for additional information on the subject. Advice and external links are dependent on the rule type, and for some rules, only advice will be shown.
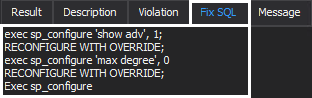
The FixSQL tab shows the script which can be executed on the target SQL Server in order to correct the detected issue. Each rule has its own FixSQL script, but in some cases, there is no script, and a manual correction will be required based on the advice shown in the Violation tab.
FAQ:
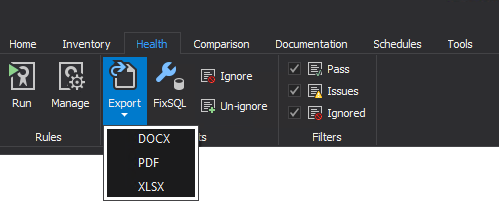
- Q: Can the health check results be exported?
A: Yes. The export option is located below the Health tab in the Results section of the main ribbon.
Supported export formats are DOCX, PDF, XLSX:
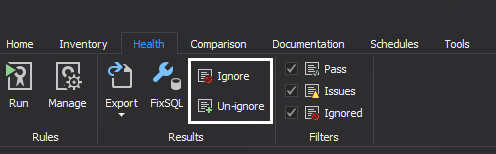
- Q: Can I ignore rules in case of false positives?
A: Yes. The option to ignore or un-ignore rules is located below the Health tab in the Results section of the main ribbon:
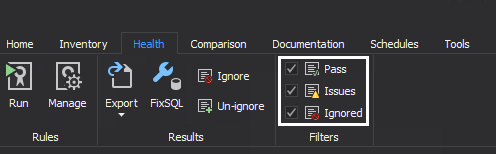
- Q: Can I see only results for failed rules?
A: Yes. Filter options are located in the Filters section of the Health tab . Individual health check results can be shown for rules that have resulted in Pass, Issues or Ignored: