The components in the Spotlight home page are visual objects that correspond to important features of the system Spotlight is monitoring. Components can be of many different types, including buttons, gauges, data flows, queues, spinners, and containers.
Note: They change color to alert you to performance bottlenecks. Spotlight Alarms
| Component |
Description |
Component | Description |
|---|---|---|---|
 |
Button - Sometimes called a process icon. A Spotlight component that contains a single value that represents the state or existence of a process. |
 |
Data flow - Panels in the Spotlight home page may be connected to other panels by data flows that show the rate at which data is moving through a system. As the rate increases, so does the speed of the flow. |
 |
Gage - A Spotlight component that shows a measurement as a continuous range of possible values. |
 |
Queue - Spotlight component that shows a measurement as a range of discrete values. The globe at the end of the queue is an alarm indicator. |
 |
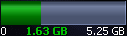
Container - A cylindrical component that fills up as the value it measures increases. Normally used to indicate file size or disk usage. |
 |
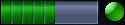
Spinner - Spotlight component that shows a measurement as a rotating wheel. The higher the value, the faster the speed of rotation. |
| Action | Description |
|---|---|
| Hover the mouse over the component |
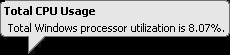
Opens information on the status of the component.
|
|
Click on the component. |
Shows What's this help or performs other customized action. Balloon help |
| Right click on the component | What's this |
Opens information about the component in balloon help. If an alarm is raised on the component, then opens help for resolving the alarm. Spotlight Alarms |
| Right click on the component | Show History |
View the recent history of the component. Tips:
|
| Right click on the component | Show Details | View a drilldown page for the component. Spotlight drilldown pages contain a detailed breakdown of the statistics used to diagnose the component. |
| Right click on the component | Snooze alarm |
Ignore (Snooze) Alarms Components with snoozed alarms are represented by |
| Right click on the component | Copy to Clipboard | Copy To Clipboard |
| Right click on the component | Restore Default Settings | You can change the appearance and behavior of Spotlight components. Restore Default Settings |
| Right click on the component | Metrics | |
| Right click on the component | Properties | |
Click  . . |
This icon indicates the diagnostic server is unable to collect the data required for the affected component. Click the icon for more information. |
 |
Data for this control is not available. (There are no alarms associated with this control.) Component Properties - Overhead Page |
 |
Data for this control is not available. (Alarms associated with the control are disabled.) Component Properties - Overhead Page |
Calibrate Spotlight Connections
To set the maximum display value for a Spotlight home page component
Configure as appropriate:
| Option | Description |
|---|---|
|
Name |
The display name of the component. |
|
Maximum value |
Some components on the Spotlight home page display metric data as positions on a bar or graph. You can say how much of this bar or graph to display by entering a value in the Maximum Value property. Click … and enter a new maximum value. Note: For components that do not display metrics as a position in a range, the Maximum value is set to zero by default. |
For the Spotlight connection
This deletes all customized properties for the Spotlight connection, including any Spotlight overhead settings.
For a Spotlight component
This deletes all customized properties applied to a chart or grid or Spotlight home page component. For a grid, this removes all changes to column headings and word-wrapping. For a chart, this removes changes made to chart style, scaling, legends and series.
To copy the chart or grid to the clipboard
Copy:
| Toolbar | Menu | Shortcut |
|---|---|---|
Click  |
Right click the chart or grid data and
select Copy to Clipboard. |
N/A |
Paste from the clipboard to the desired destination – as an image within an image editor, or as text within a text editor.
Tips:

 .
.