If you have trouble connecting to an Adaptive Server instance using Spotlight, check that you can do the following:
The most common problems are listed in the following table:
| Symptom | Possible Problem | Likely Problem | Validation |
| Can’t make connection to the ASE |
Getting correct account information (login name/password) |
N/A | N/A |
| Entering the right connection properties (port, hostname, etc.) | N/A | N/A | |
| Spotlight is hanging or the connection appears to be very slow |
The Adaptive Server itself is having issues (database or transaction log full, CPU load is high, etc.) |
N/A | N/A |
| No data in the drilldown grids | Entering the wrong case for the Adaptive Server name (12.5.0.3 issues only). After you make a connection to a Adaptive Server on UNIX, case does matter, and this is reflected in a wrong entry being made to the sysservers table for a loopback entry. This, in turn, causes problems with retrieving any MDB-related data. | N/A |
From within ISQL, run “select*from master.. sysservers.” Look at the row with “loopback” in the “srvname” column. On that row, look at the entry for column “srvnetname.” Is that name case correct? If not, issue the following command to correct: “sp_addserver loopback, null, CASE CORRECT ADAPTIVE SERVER NAME” |
| The monitoring tables available in Adaptive Server 12.5.0.3 or later are not installed. Run the InstallMonTables script (found in the Adaptive Server directories). |
From within ISQL, run “select*from master.. monState.” If you get an error message that the table is not found, that means that the installmontables script has not been run. You can run the script using the following ISQL utility: “isql -Usa- Password -i $SYBASE/ASE- 12_5/scripts/ installmontables”
| ||
Spotlight® on SAP ASE is a powerful diagnostic and problem resolution tool for Adaptive Server Enterprise. Its unique user interface provides you with an intuitive, visual representation of the activity on your database and operating system.
The underlying architecture for Spotlight is designed for ease of installation and use, and offers a range of tools to create custom solutions for problem diagnosis.
Spotlight® on SAP ASE is packaged in a quick and simple installation program.
Spotlight® on SAP ASE is a client-only installation. This agent-less architecture has many advantages:
Spotlight alerts you with visual and audible warnings and alarms when performance metrics exceed acceptable thresholds.
Spotlight’s unique graphical representation allows a database administrator to quickly spot performance problems on an Adaptive Server. Spotlight is tailored to show the process dataflow unique to Adaptive Server and to highlight performance-related details to the administrator.
Spotlight visually identifies problem areas: active sessions, locks, deadlocks, and disk I/O information providing extensive drilldown capabilities for rapid problem resolution. A range of reports and graphs provides you with detailed information about your server environment for up to 24 hours. This information can be viewed on the screen or printed.
When Spotlight detects a condition that appears to be a potential problem, it not only informs you about it, but advises you what you could look at to diagnose the problem further and suggests actions you can take to correct the situation.
Spotlight utilizes a powerful facility called calibration. Calibration allows each Adaptive Server being monitored by Spotlight to have its visual displays and thresholds dynamically adjusted. The adjustments are based on measured activity on the server. This allows Spotlight to represent each server’s unique performance characteristics in the context of the server’s expected behavior.
Calibration can be turned on for a designated period of time (ideally during a time frame where activity on the Adaptive Server is at typical levels). During this time, Spotlight performs statistical sampling on the metrics being monitored. These statistical values are then utilized by the metric components displayed and the related thresholds.
Spotlight graphically represents process flows within an Adaptive Server, allowing you to observe activity in real time. The speed of the flows represents true activity levels on the server. Flow speed is dynamically adjusted with Spotlight’s statistical sampling process called calibration.
Using a variety of methods, Spotlight defines the thresholds at which performance warnings and alarms operate.
This allows Spotlight® on SAP ASE to provide you with accurate and meaningful alerts quickly, out of the box.
You can customize each threshold level. In addition, custom actions (i.e., email, paging, etc.) can easily be assigned to any alert defined to Spotlight.
Spotlight has integrated with SoWin and SoUNIX to enable monitoring of Host CPU usage and related metrics. The Host CPU usage is now clearly visible on the Spotlight Home page. Linkage is provided to other SoWin and SoUNIX products depending on the type of server host that is being monitored.
Spotlight monitors historical data within its data repository. This historical data may be accessed through the Spotlight history browser.
Spotlight uses metrics, thresholds, and severities to determine the performance statistics of a system. Icons, flows, and labels graphically display this information in the main application window.
A metric is a measurable value resulting from a request made against the target machine. This query runs each time the main application window is refreshed.
The query provides a performance statistic about the system, the number of machines that have at least one server session, and return a value to Spotlight.
Each metric is divided into thresholds. Some metrics may have only one threshold, while others can have many. A threshold is simply a range of values that can be returned by the metric. A threshold cannot belong to more than one metric.
Each threshold is associated with a severity. The severity determines what action Spotlight is to take when the value returned by a metric falls into the range controlled by a threshold. For example, you may set a severity to display a color, flash a color, emit a sound, or perform an action.
Alarms are attached to severities.
The following diagram shows an example of the relationship between metrics, thresholds, and severities.
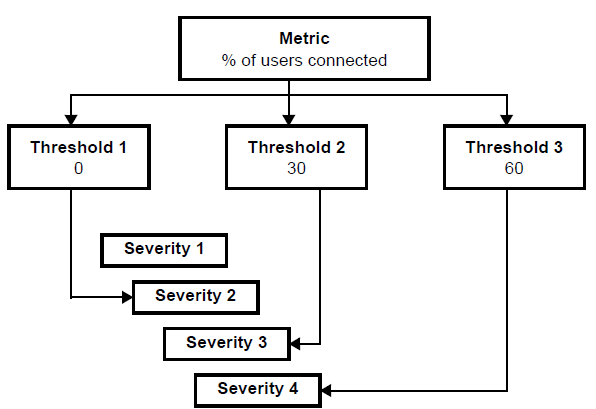
In the above example, the query (% of users connected) is run against the database, and any values returned can fall into one of three ranges called thresholds. If the query returned the value 20%, the value would fall into the range covered by Threshold 1.
In this example, Threshold 1 is attached to Severity 2. You can choose via the Spotlight Console Options window to set the colors of the severity (for example, Severity 2 might be set to display in green). The component that the metric belongs to then changes to green whenever that threshold is exceeded.
