
Cloning an Alert Response
You can create a new alert response based on existing one using the Clone Alert Response option.
To clone an alert response:
1In the Alert Responses dialog, click the alert response on which you want to base the new one.
2In the ribbon, click the Clone Alert Response icon.
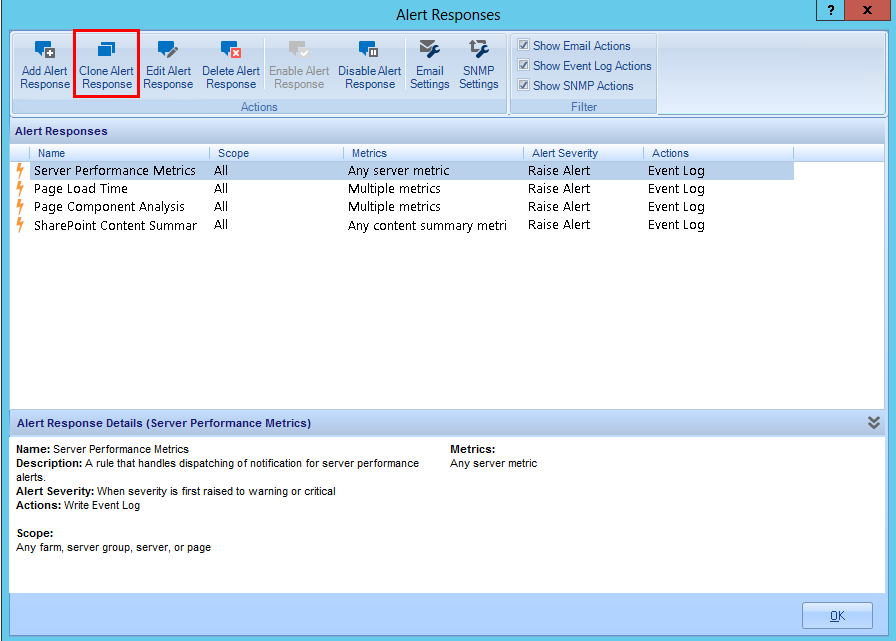
3Enter a new Name for the alert response. (By default, the name of a cloned alert response is the same as that of the existing one with "- Copy" appended to the end of the name.)
4Edit the remaining fields in the dialog as needed.
5Click [OK] to save the new alert response and close the dialog.
Customizing the Knowledge Base
Metalogix Diagnostic Manager includes a Knowledge Base with information about each of the individual metrics that it can track for the servers and pages in your SharePoint farm. When Metalogix Diagnostic Manager generates an alert, it includes the text of the Knowledge Base article.
The Knowledge Base article includes information about each metric. You can also add a custom article to the Knowledge Base for each metric. As with the built-in Knowledge Base, this custom article is included in each Alert generated for the metric. The custom article is included when an Alert is sent via email or as a Simple Network Management Protocol (SNMP) trap.
You can use the custom Knowledge Base article to specify information about your particular SharePoint environment and how alerts should be handled.
To access a Metric Knowledge Base article
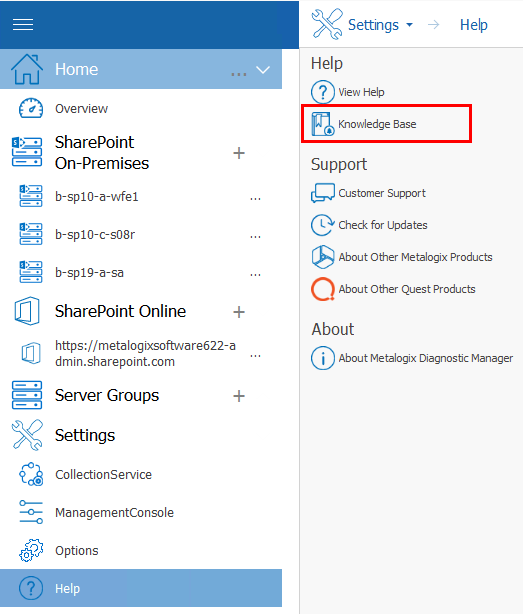
1Use one of the following options:
§In the Management Console left hand panel, select Help, and then select Knowledge Base.
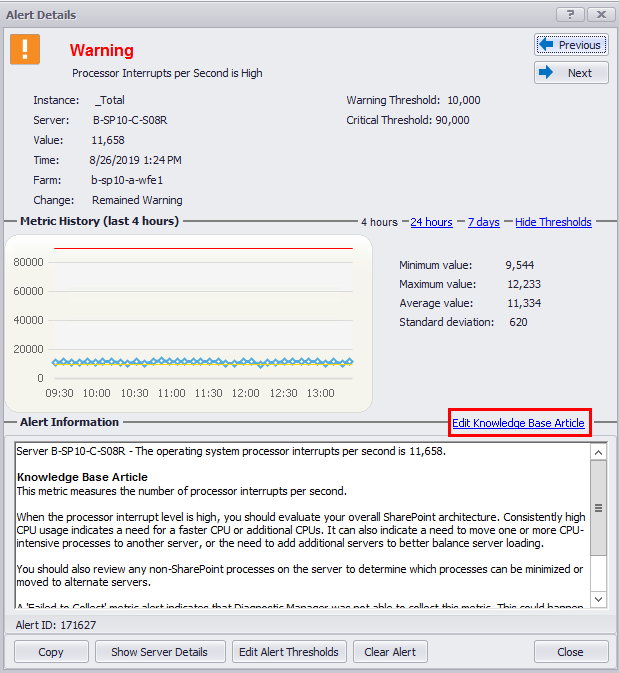
§In the Alert Details dialog box for a specific alert (see "Viewing Alerts"), click the Edit Knowledge Base Article hyperlink.
2In the Metric Knowledge Base dialog, select the metric whose Knowledge Base article you want to customize. You can click the plus (+) symbol beside a metric group to expand it.
To customize the Knowledge Base:
1In the Custom Knowledge field, type or paste the information that you want to include in the custom Knowledge Base article.
2Click [OK] to close the dialog box and save the changes.
To copy a Metric Knowledge Base article to the clipboard:
1Select the metric whose Knowledge Base article you want to copy.
2Click [Copy].
Stopping Alerts During Maintenance Mode
To stop alerts during maintenance mode, you must disable monitoring of the respective server and the alerts for that server are automatically stopped.
To disable monitoring of a server:
In the multiple servers view, select the (...) next to the server(s) for which you want to disable monitoring. Select Disable from the drop down menu.
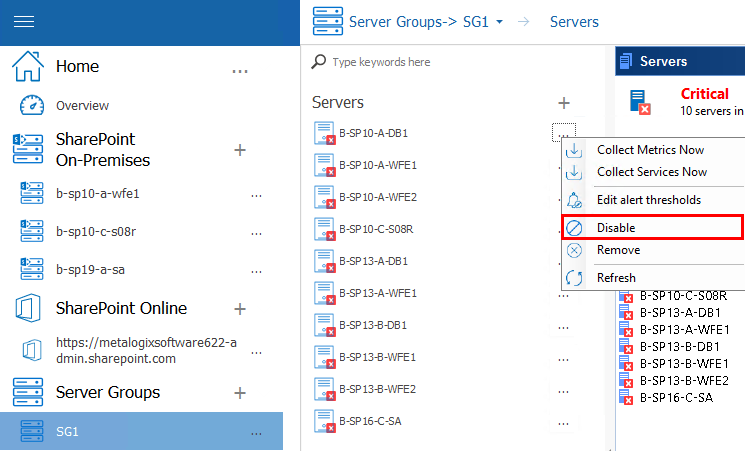
When a server is disabled, all alerts related to this server are automatically stopped.
To enable monitoring of a disabled server:
In the multiple servers view, select the (...) next to the server(s) for which you want to enable monitoring. Select Enable from the drop down menu.
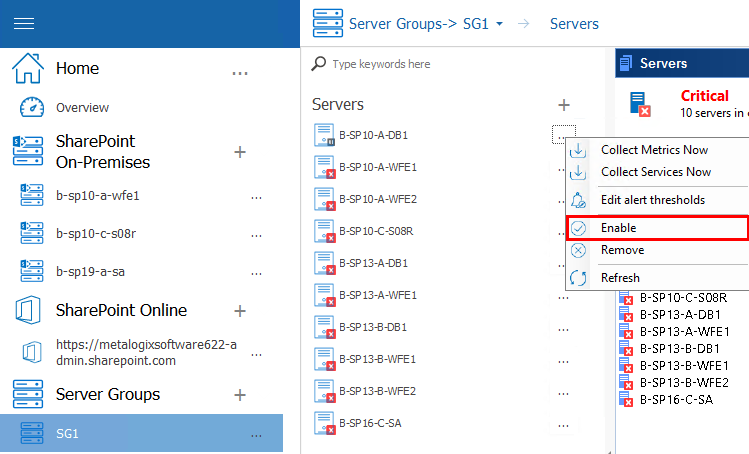
The Management Console enables data collection for the server. When the disabled server is enabled, the respective alerts are reinstated.
Viewing and Reporting on the Performance of SharePoint Farms, Server Group, and Office 365 Tenants
Metalogix Diagnostic Manager lets you view and report on the availability of your SharePoint farms, the servers in SharePoint farms and Server Groups, and the web pages in the SharePoint sites, as well as public and Cloud Services web pages. You can view the status of individual farms, servers, or pages, locate performance issues, and correct them.
For Office 365 tenants, you can view the latest status of Office 365 services and their features.