Viewing Dashboards and Overviews
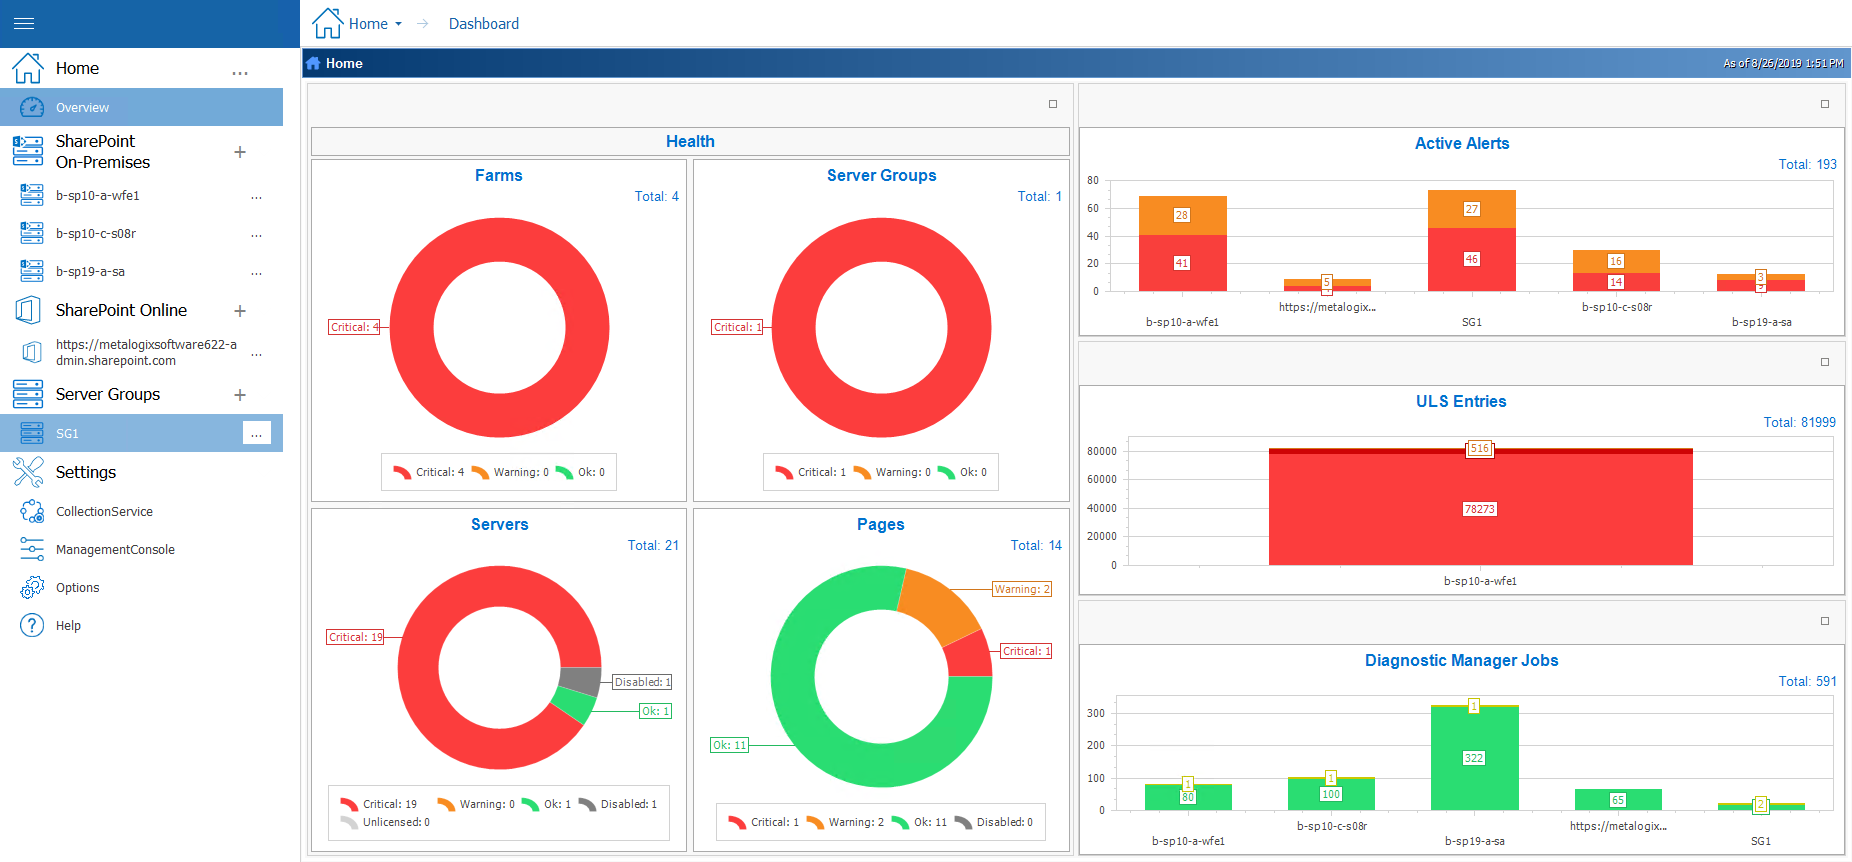
When you select the top node of a monitored SharePoint farm, Server Group, or O365 tenant, a default dashboard displays, which provides a graphical representations of the environment's overall health and various key metrics.
|
|
NOTE: You can also return to the dashboard from another location by choosing Home > Overview. |

Default Home Page Dashboard
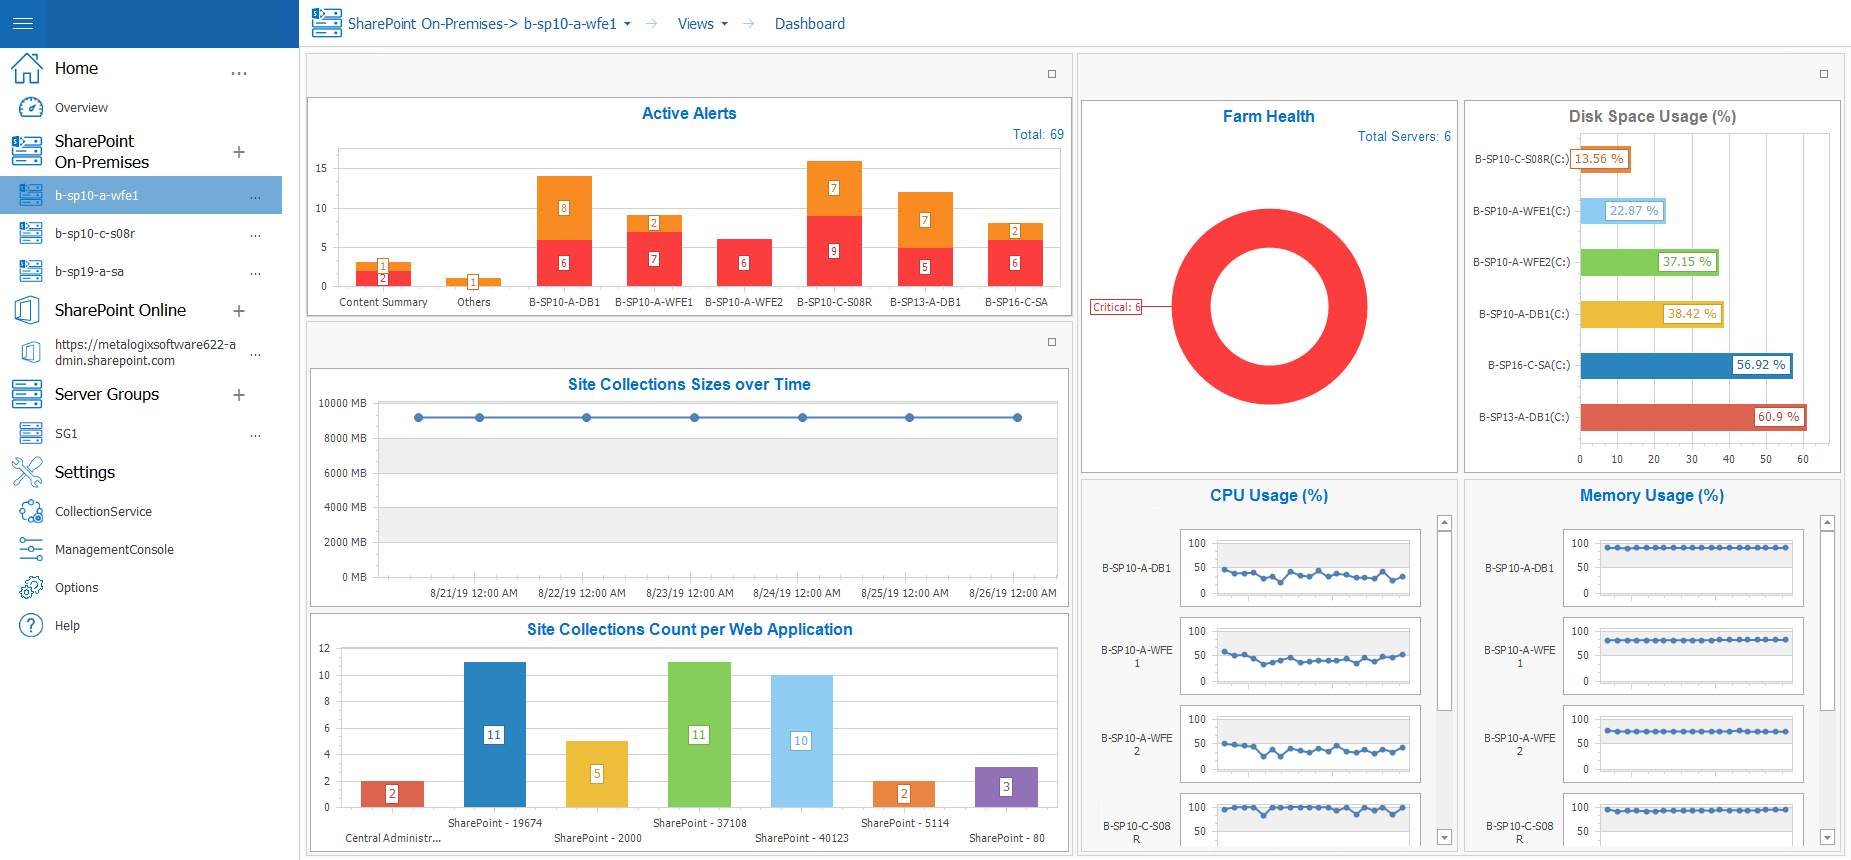
Default On Premises SharePoint Farm Dashboard
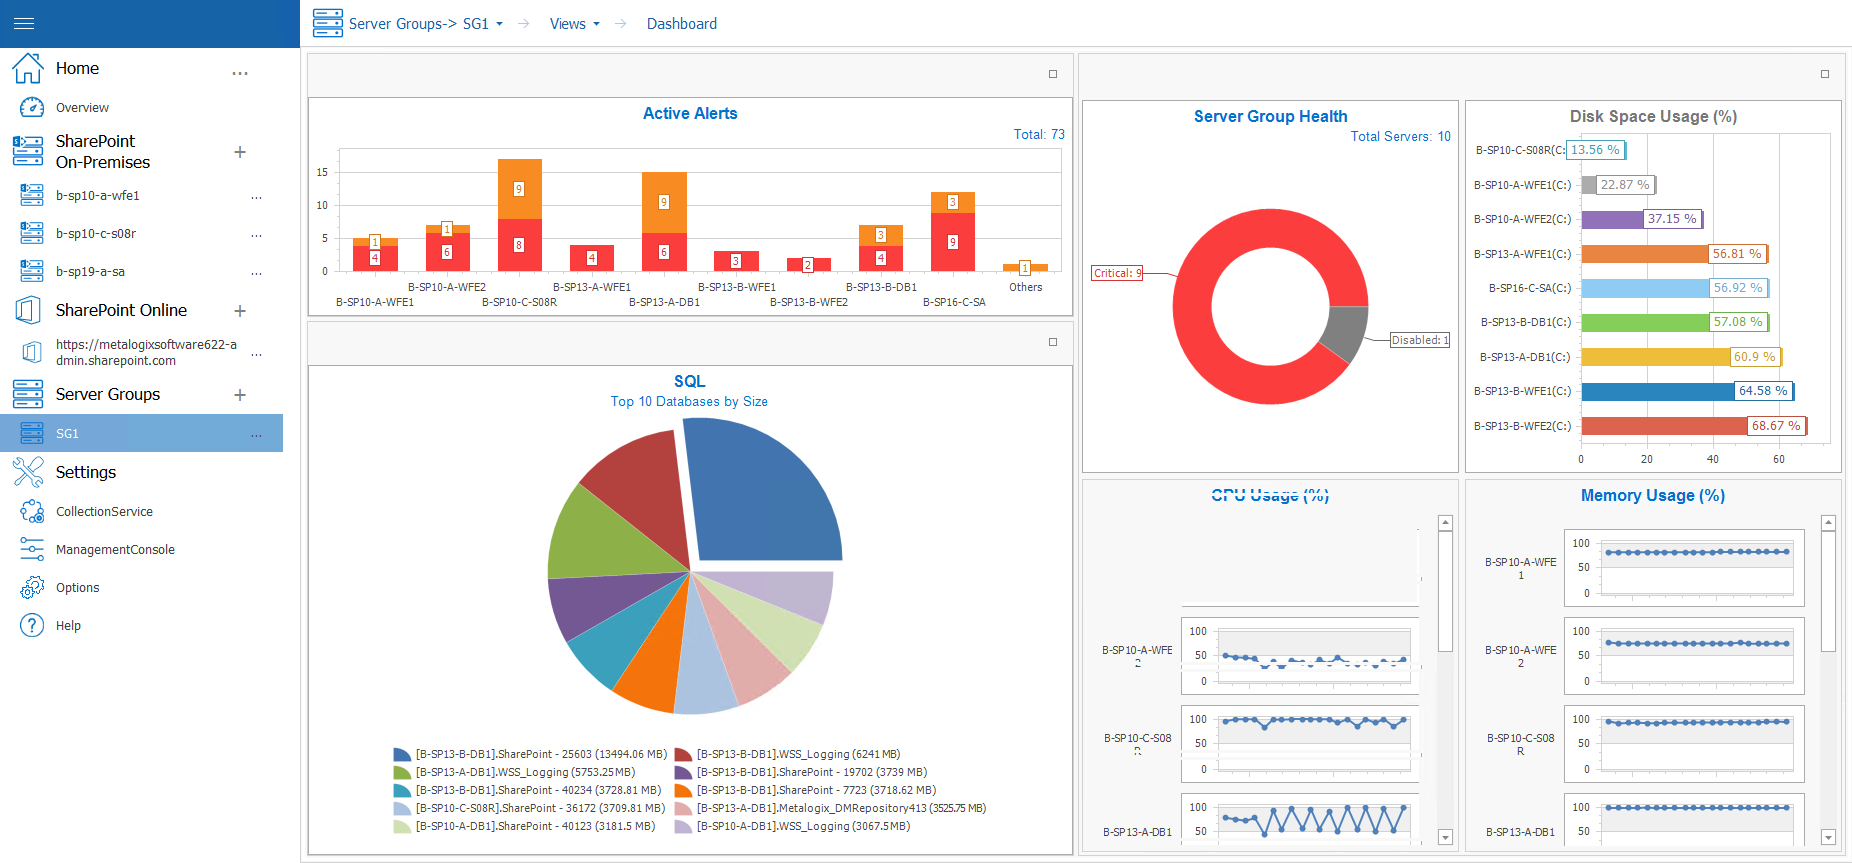
Default Server Group Dashboard
Default O365 Tenant Dashboard
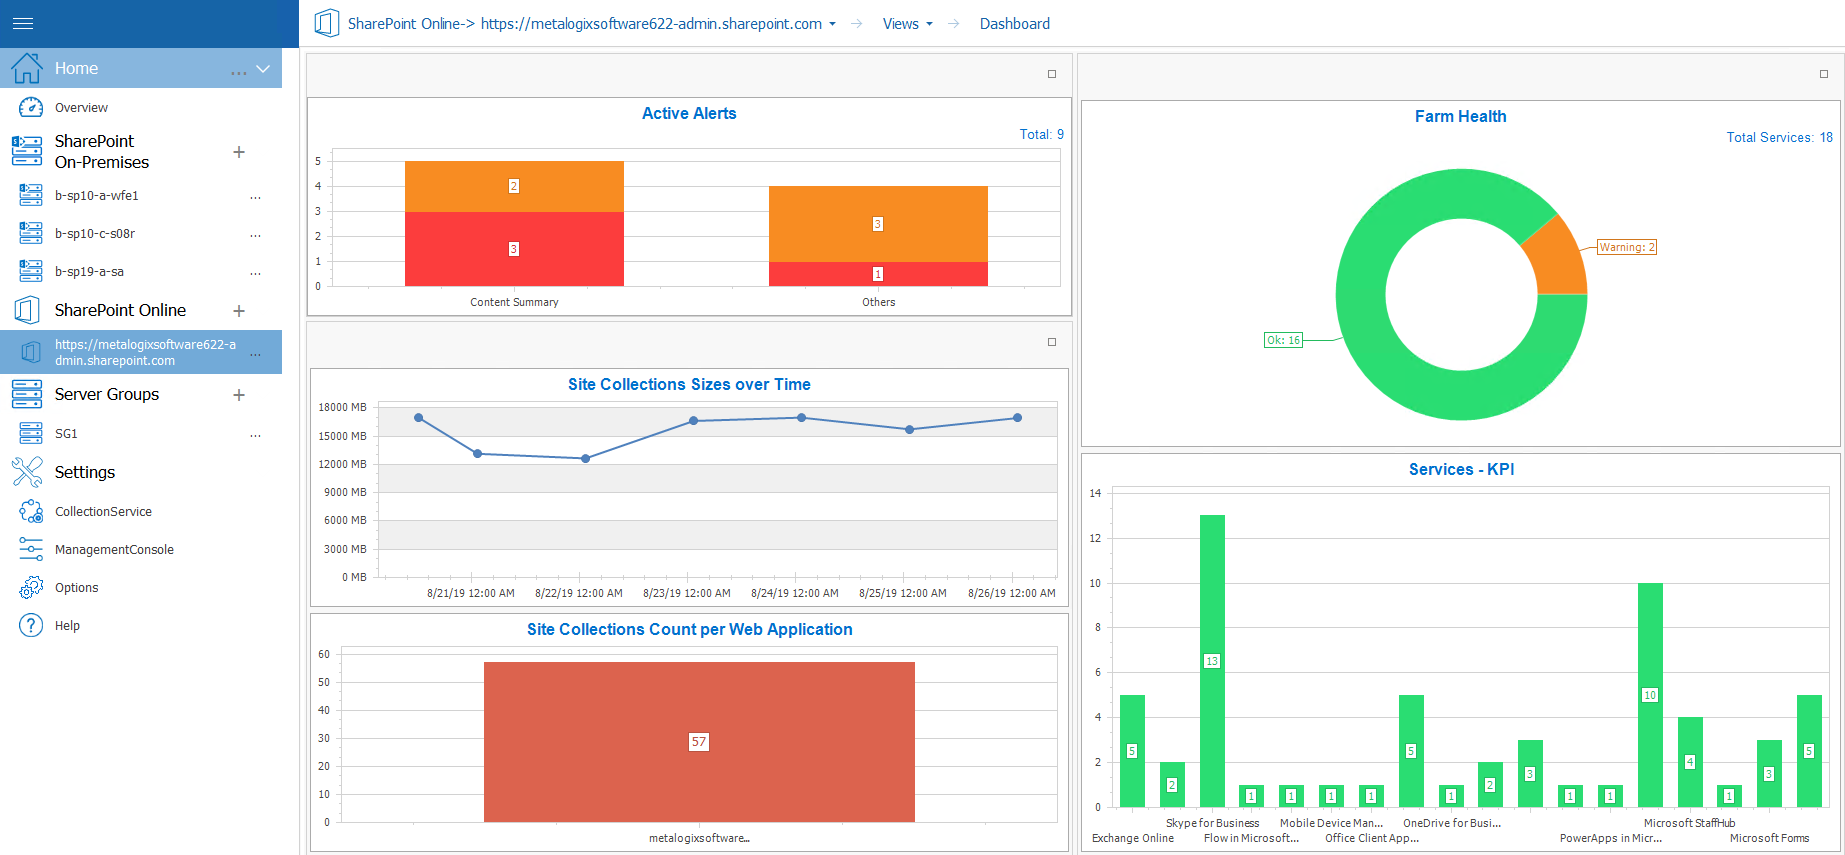
You can double-click on a statistic within a widget to drill down to more detail about the underlying data set.
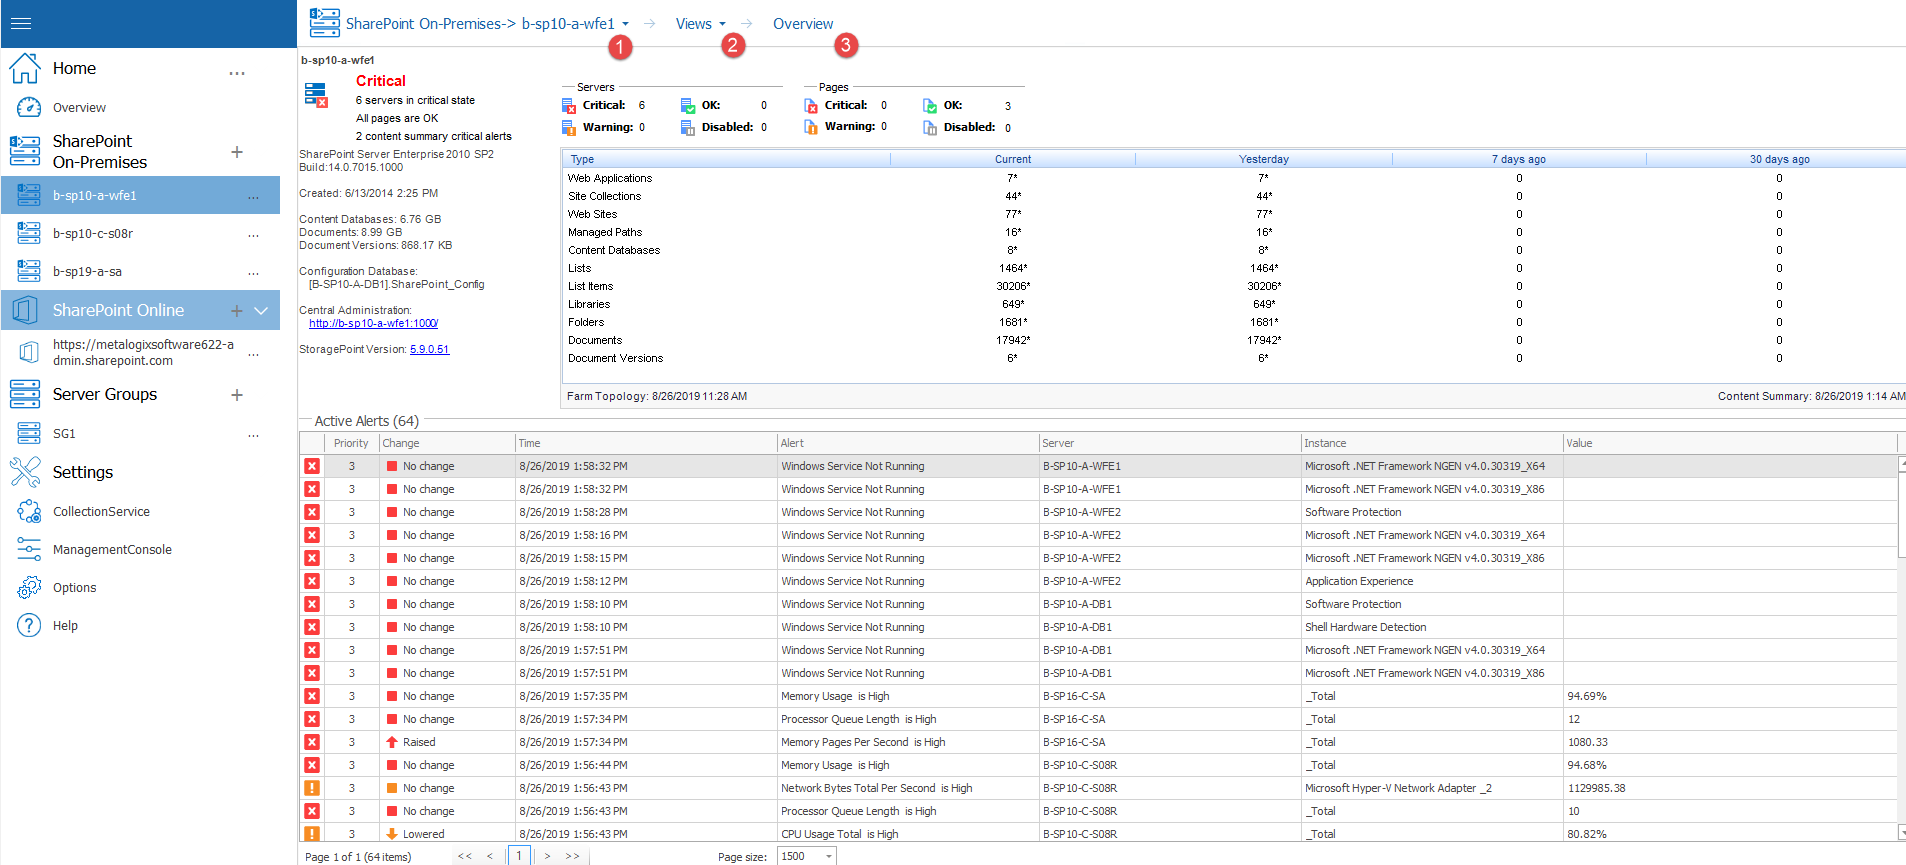
For a more detailed overview, including a list of all monitored pages and active alerts, double click the SharePoint on-premises farm or sharepoint online farm. Click on the farm name, select Views, and then click views and select Overview.
Customizing Dashboards
You can customize the dashboards that display on the home page and for each SharePoint farm, Server Group, and O365 tenant. You can also create additional custom dashboards.
|
|
NOTE: created, additional dashboards can be selected from the Saved Dashboards drop-down. |
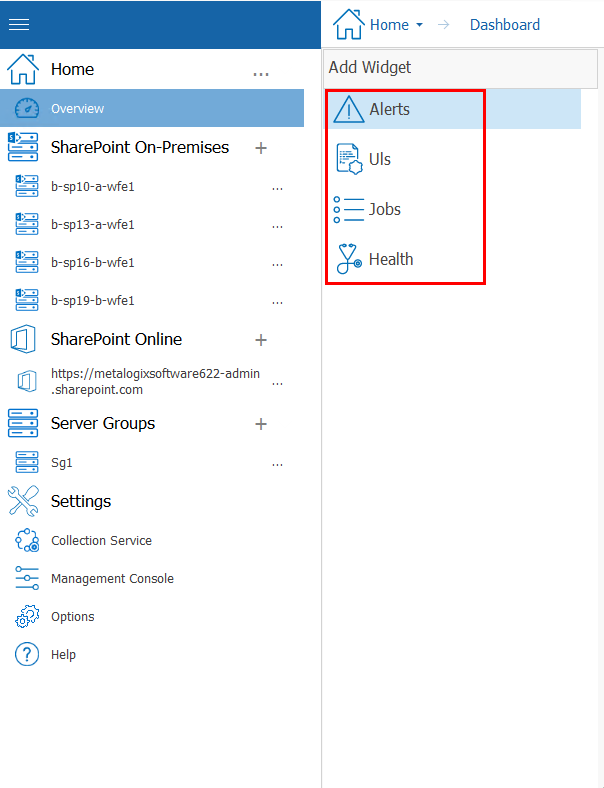
To customize a dashboard:
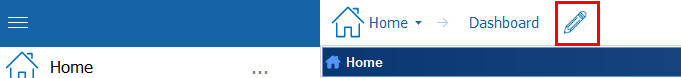
1.From the Overview tab select the pencil 'edit' symbol (Home, SharePoint farm, Server Group, or O365 tenant).
Now you can:
·click the X in the upper right corner of a widget to remove it from the dashboard
·drag and drop to reposition or resize a widget
·add a widget from the left hand pane by double clicking on it.
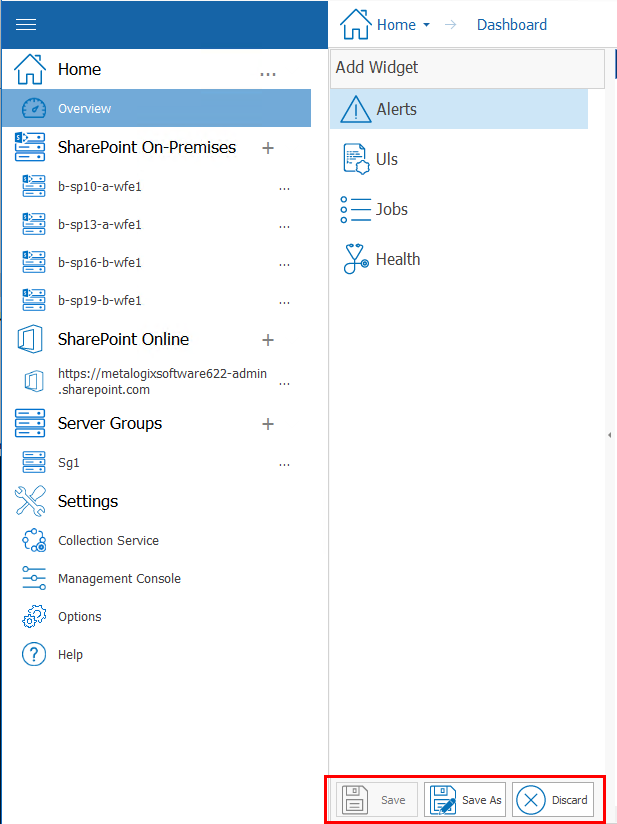
When you finish editing, you can Save the changes to the dashboard, Save As a new dashboard, or Discard Changes.
Viewing the Status of Office 365 Services
If your Metalogix Diagnostic Manager deployment includes one or more Office 365 tenants, you can view the latest status of Office 365 services and their features.
|
|
NOTE: ·Metalogix Diagnostic Manager retrieves server status according to the schedule specified on the Collection Service Options - Office365 tab (which is every 15 minutes by default). You can also force the Collection Service to update status information immediately. ·If you want to monitor O365 services on a machine without Internet access, you can configure web proxy settings. |
To view the health of Office 365 Services:
1.In the Management Console tree, select the node the Office 365 tenant whose health you want to view. Once it opens in the viewing pane, select the name of the tenant, select Services.
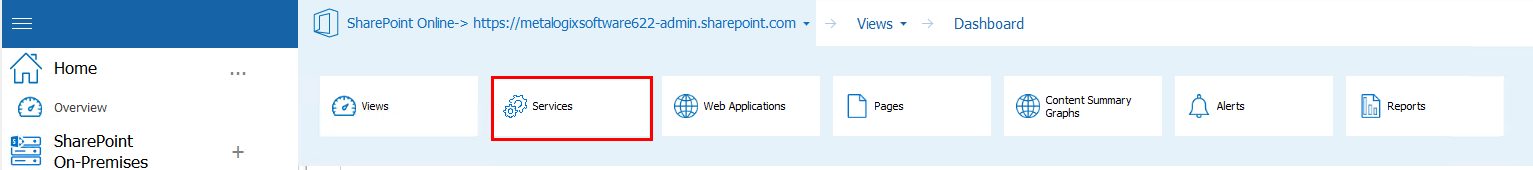
Tiles representing all of the active services in your Office 365 tenancy display, along with one of the following status icons:
|
|
OK |
|
|
Warning |
|
|
Critical |


The right bottom corner of the tile provides a brief description of the current status.
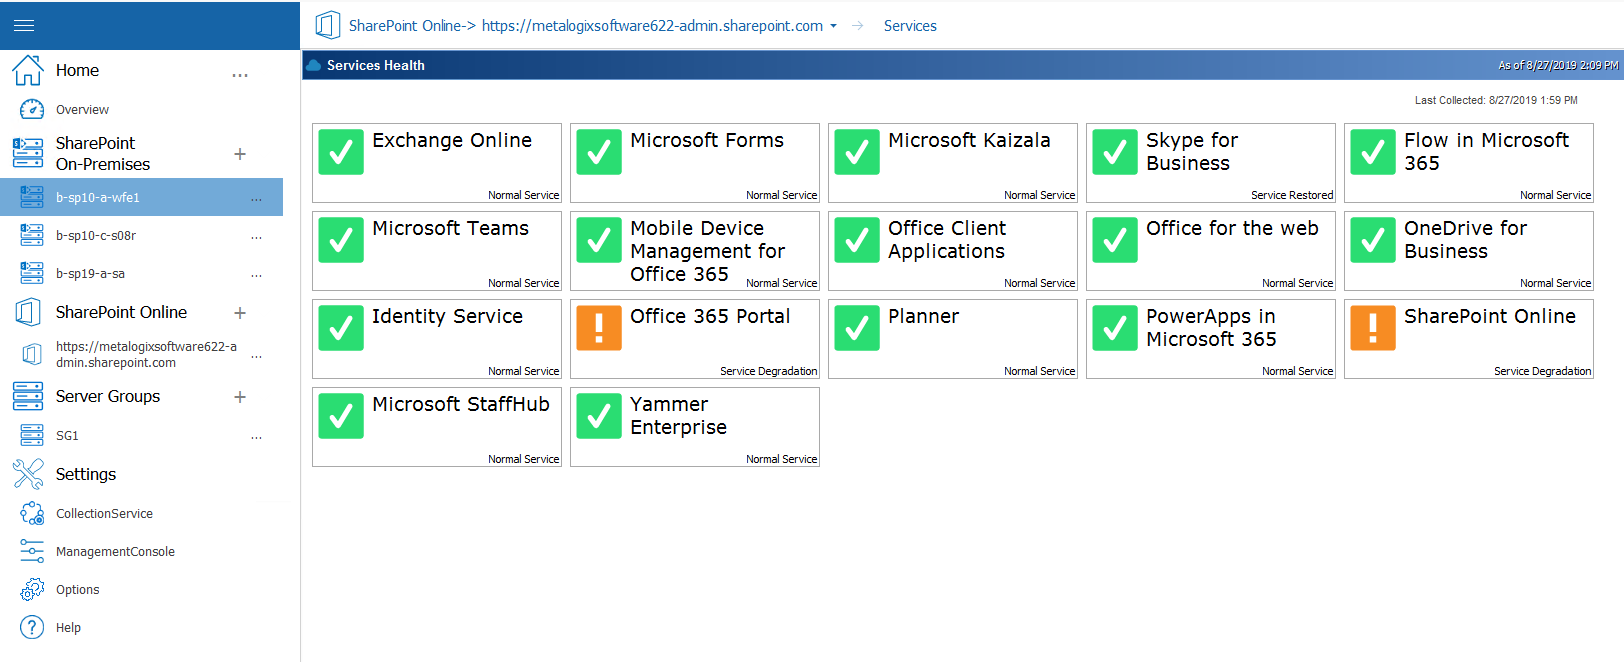
2.To view the status of a service's features, click on the service tile.
If you select a feature with a status of Warning or Critical, Latest description text provides additional information.
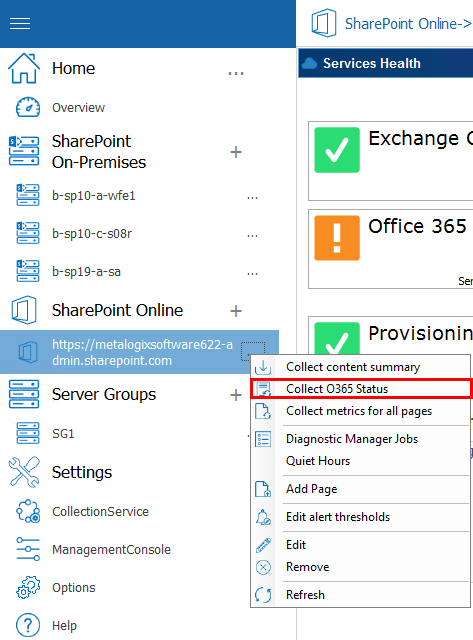
To collect Service status data immediately:
From the Management Console tree, select the Services node, click the (...) next to the name, and choose Collect Farm O365 status.
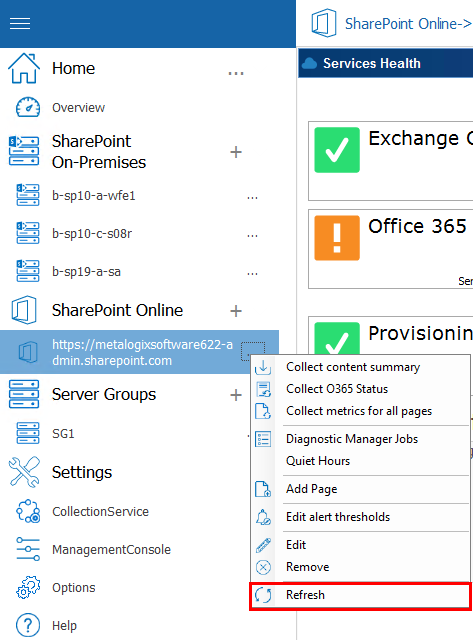
To refresh displayed Service status data in the Management Console:
From the Management Console tree, select the Services node, click the (...) next to the name, and choose Refresh.
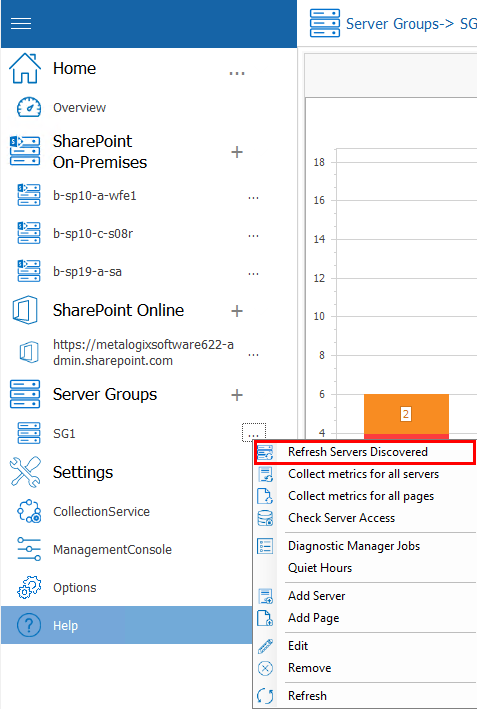
Refreshing Server Group Properties
The Metalogix Diagnostic Manager Collection Service automatically refreshes the properties of a Server Group. By default, this data is collected every 24 hours, at the same time Farm Topology is refreshed. You can also force the Collection Service to refresh the properties of servers in the group at any time to reflect any changes have been made since the last data collection (for example, a SQL server instance has been added or removed).
To refresh Server Group properties:
1.In the Management Console tree, select the Server Group whose properties you want to refresh, select (...) and Refresh Servers Discovered.