立即与支持人员聊天
与支持团队交流

Foglight Hybrid Cloud Manager 1.6 - User Guide (for Azure environments)

Reports Tab

Foglight Hybrid Cloud Manager for Azure includes a report generation ability. This allows you to create reports using a set of predefined templates to report on the various aspects of your cloud environment. Foglight Hybrid Cloud Manager for Azure includes a collection of predefined report templates.

You can generate, copy, and edit reports using the Reports tab on the Report dashboard, or alternatively the Reports dashboard included with the Management Server.

Figure 22. Report dashboard

3
On the navigation panel, under Homes, click Cloud Manager.
The Cloud Manager dashboard opens.
4
Click Report in the actions bar.

For complete information about this tab, see the Managing Capacity in Virtual Environments User Guide. For more information about the Reports dashboard, see the Foglight User Help.

Available report templates

The following templates are available with Foglight Hybrid Cloud Manager for Azure.

Azure Resource Group Performance Report - Summary

Summarizes your Resource Group, so that you could know all Resource Group' performance.

Azure Storage Account Performance Report - Detail

Summarizes the capacity and performance details of the selected Storage Account.

Azure Tenant Performance Report - Summary

Summarizes your Tenant infrastructure, so that you could know your Tenant's performance.

Azure Virtual Machine Performance Report - Detail

Summarizes the capacity and performance details of the selected Virtual Machine.

Azure Virtual Machine Performance Report By Tenant - Summary

Summarizes the capacity and performance details of all Virtual Machines.

Cost - All Subscriptions Summary Report

Summarizes the cost for all subscriptions.

Cost - Single Subscription Cost Report

Summarizes the cost for select subscription.


Rule Configuration Tab

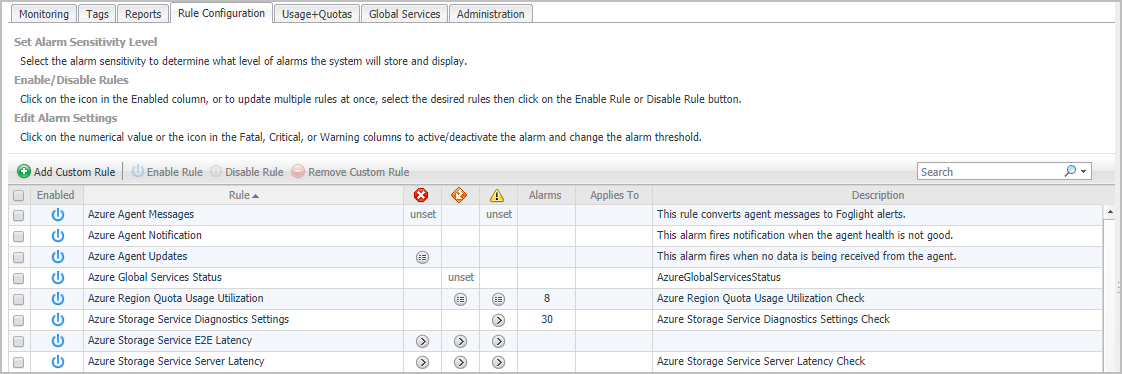
The Rule Configuration tab of the Cloud Manager dashboard contains links to rules and alarms tasks that you can use to manage Azure rules and alarms.

3
On the navigation panel, under Homes, click Cloud Manager.
The Cloud Manager dashboard opens.
4
Click Rule Configuration in the actions bar.

For more information, see the following topics:

Rules view

By default, the following columns are displayed in the Rules view:

Enabled: Indicates if the rule is enabled or disabled . You can sort the list of rules by state, by clicking the Enabled column.
Rule: Contains the rule name. Click the rule name to start the workflow for viewing and editing rule details.
Alarms: Contains the number of alarms (multiple-severity rules only) generated by the rule. Clicking that column shows a list of alarms indicating for each alarm its severity, when the alarm was generated, and the alarm message.
Applies to: Shows the object name that is applied to this custom rule.
Description: Contains the rule description.
相关文档

The document was helpful.

选择评级

I easily found the information I needed.

选择评级