This view is a tree view. It lists the virtual centers that exist in your environment and shows their state.
Selecting the All Virtual Centers node displays overall resource utilization for all virtual centers in your integrated system, and the elements that consume the highest amount of system resources in the
Summary (All Virtual Centers) view on the right. Similarly, selecting a server node shows server-specific metrics in the
Virtual Center Summary view on the right.
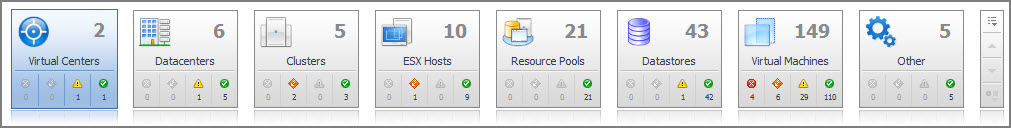
Click the object type icon, the object type name, or the object count, to view summary information for that entire object type in the Quick-View. Click an alarm state (for example, warning) on a tile to view summary information in the Quick-View for the objects of that type that are in the selected alarm state.
The Virtual Machine Summary view shows the overall resource utilization and the amounts of system resource consumption for a virtual machine.
The Summary - All Virtual Machines view displays overall resource utilization information for a group of virtual machines and shows the elements that consume the highest amount of system resources.