立即与支持人员聊天
与支持团队交流

Foglight for Oracle (Cartridge) 5.9.4.20 - User Guide

Installing and Configuring Agents Using Foglight for Oracle
Viewing the Databases Dashboard Assigning Instances to Users Selecting an Instance to Monitor Foglight for Oracle Overview Dashboard Overview view Advisories view SQL Performance Investigator (SQL PI) Oracle Activity Drilldown Pluggable Databases Drilldown Storage Drilldown Reviewing Configuration Settings Reviewing the Alert Log Reviewing Monitored Data Guard Environments Reviewing ASM Instances Reviewing Exadata-related Information
Administering Foglight for Oracle Reporting Reference Glossary

Reviewing Alert Log Information

The Alert log tab displays the entire alert log messages with the relevant severity, as defined in the Match List. Only messages that appear in the Ignore List will not be displayed in this screen.

Reviewing Exadata-related Information

Starting from version 5.6.5.330, Foglight for Oracle monitors Exadata database machines, both from the hardware and software aspects, using the Exadata drilldown.

The Exadata-related information is presented only in RACs where Exadata is configured. While Exadata appears as one of the drilldowns, clicking Exadata opens an Exadata dashboard.

The Exadata dashboard comprises the following drilldowns:

Displaying Exadata-related Summarized Data

The Summary drilldown provides summarized data about the performance and resource utilization of the Exadata cells.

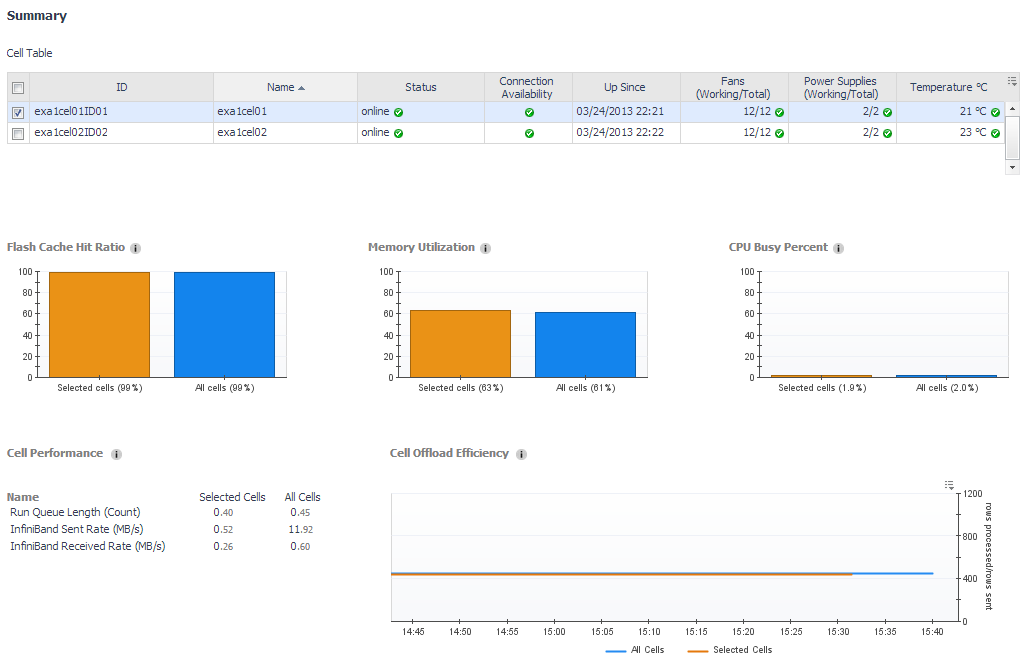
This drilldown comprises the following components:

The cell table provides the following details about each alert log:

The performance and resource utilization indicators includes the following components.

Flashcache Hit Ratio (%)

Displays the percentage of block requests resolved from the cell flash cache falls below a predefined threshold. This figure is displayed for the selected cells, as well as for all cells.

Block retrieval is carried out significantly faster by accessing the flash cache, as this cache resides on high-performance flash SSD. Low flash cache hit ratio indicates that many blocks are being retrieved from the regular disks, possibly resulting in performance issues.

Memory Utilization (%)

Displays the memory utilization for the selected cells, as well as for all cells.

Overly high memory utilization can result in excessive swapping, which is likely to lead to performance issues.

CPU Busy Percent (%)

Displays the CPU utilization for the selected cells, as well as for all cells.

Overly high CPU utilization can result in excessive swapping, which is likely to lead to performance issues.

Cell Performance

Displays several key indicators for the cell’s performance, as follows:

Cell Offload Efficiency

The number of rows processed by the cells for all the queries divided by the number of rows forwarded by the cells to the DB node instances.

Higher values of this metric indicate that the cells made good use of their CPUs and high I/O bandwidth to process high number of rows, extract the relevant ones and only forward those to the DB nodes.

Reviewing the Exadata Performance

The Performance drilldown includes the following components:

The Celldisk Response Time (ms) section displays the following metrics on all of the celldisks, as well as on the celldisks selected in the cell table:

Use the Flash Cache Statistics section to review the load on the flash cache and the number of I/O errors encountered there, by displaying the following metrics on all of the celldisks, as well as on the celldisks selected in the cell table:

The Flash Cache Usage (MB) chart displays the following metrics on all of the celldisks, as well as on the celldisks selected in the cell table:

The Flash Cache Request Misses (requests) displays the total number of read IO requests that did not find all data in Flash Cache and therefore had to perform physical read operations. This figure is displayed for all of the celldisks, as well as on the disks selected in the cell table, and is split into two charts:

The Celldisk Statistics section displays the rate (megabytes per second) of physical reads and writes that were carried out during the selected time range on all of the disks, as well as on the disks selected in the cell table.

相关文档

The document was helpful.

选择评级

I easily found the information I needed.

选择评级