立即与支持人员聊天
与支持团队交流

Foglight for Infrastructure 5.9.5 - User Guide

Using Foglight for Infrastructure Monitoring log files with Foglight Log Monitor Monitoring IBM PowerVM environments
Before you begin Managing PowerVM HMC agents Monitoring your PowerVM environment
Advanced system configuration and troubleshooting Reference
Foglight for Infrastructure views Foglight Log Monitor views Rules Metrics
Appendix: Building regular expressions in Foglight

Exploring the Infrastructure Environment dashboard

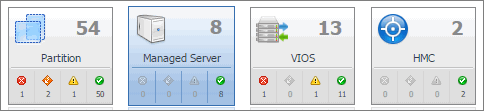
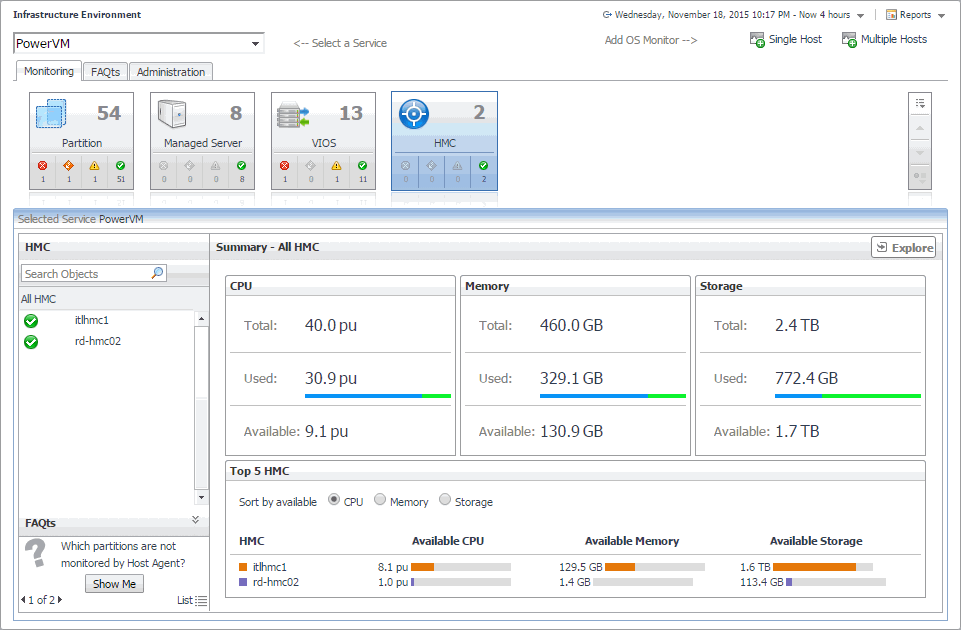
A typical PowerVM® environment includes one or more HMC instances, managed PowerVM servers, PowerVM partitions, and PowerVM Virtual I/O server (VIOS) instances. You can view the state of these components on the Infrastructure Environment dashboard when you select the PowerVM service.

The Infrastructure Environment dashboard provides a set of tabs, each displaying a different aspect of your monitored system.

The Monitoring tab displays main components of your monitored PowerVM infrastructure such as HMC instances, managed servers, partitions, and VIOS instances. When you navigate to the Infrastructure Environment dashboard and select the PowerVM service for the first time, the Monitoring tab appears open.

2
On the navigation panel, under Dashboards, click Infrastructure.
4
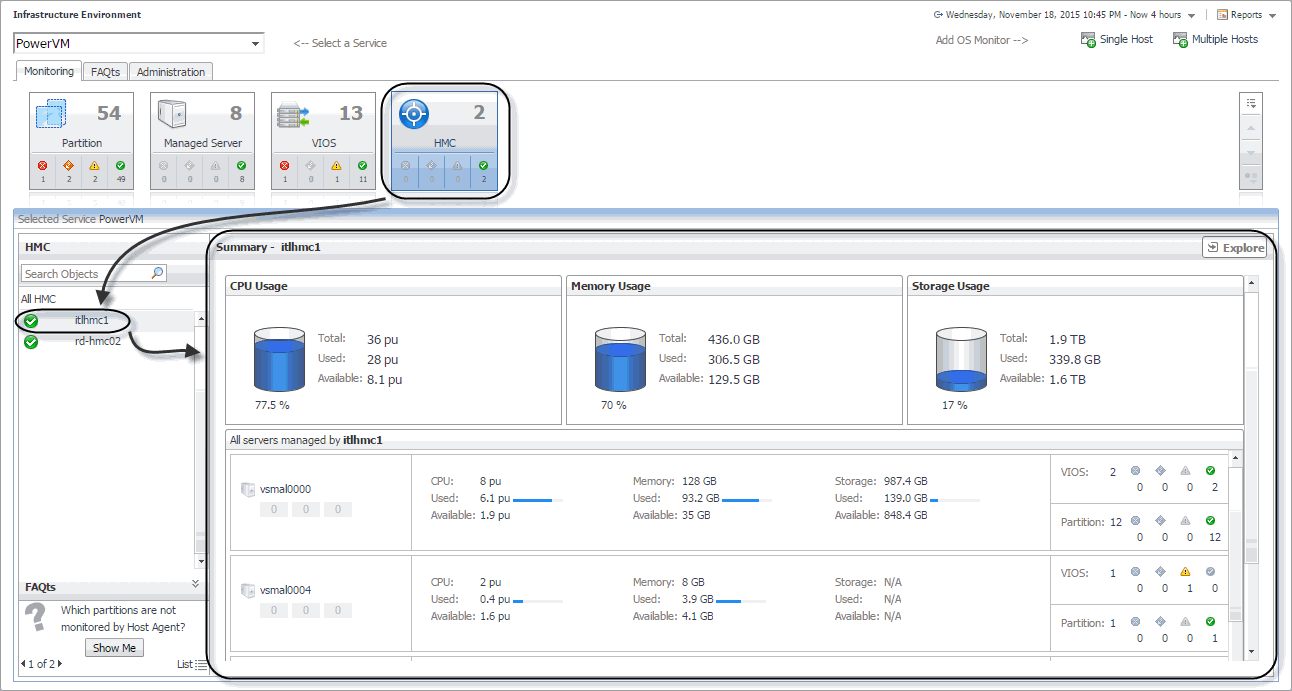
On the Infrastructure Environment dashboard, on the Monitoring tab, click a tile representing the object type that you want to investigate.
The Selected Service PowerVM view refreshes, showing the performance summary of all managed servers in the Summary - All Managed Server view on the right.
5
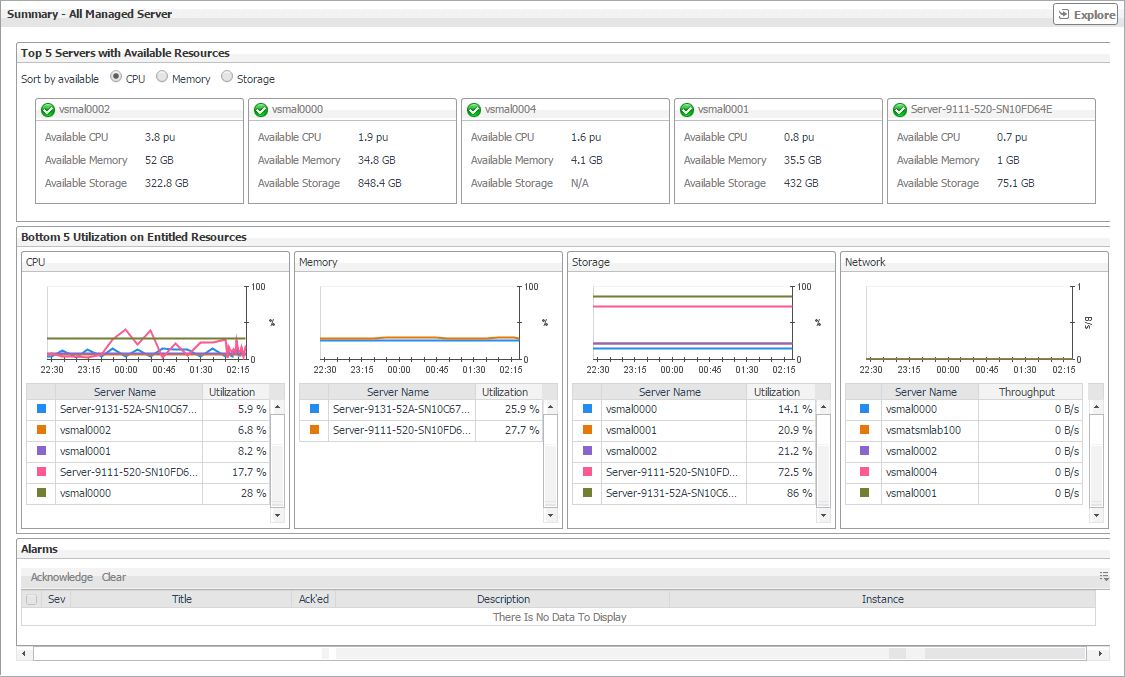
In the Managed Server view on the left, select an object instance from the list.
For example, if you selected All Managed Server, click a managed server in the list.
Figure 12. Managed Server Details view

Selecting monitored objects

A set of tiles along the top of this tab gives you a quick overview of the monitored objects: HMC instances, managed servers, partitions, and VIOS instances. Each tile represents a collection of a specific object type, shows the object count, and the count of objects in each alarm state (Normal, Warning, Critical, and Fatal).

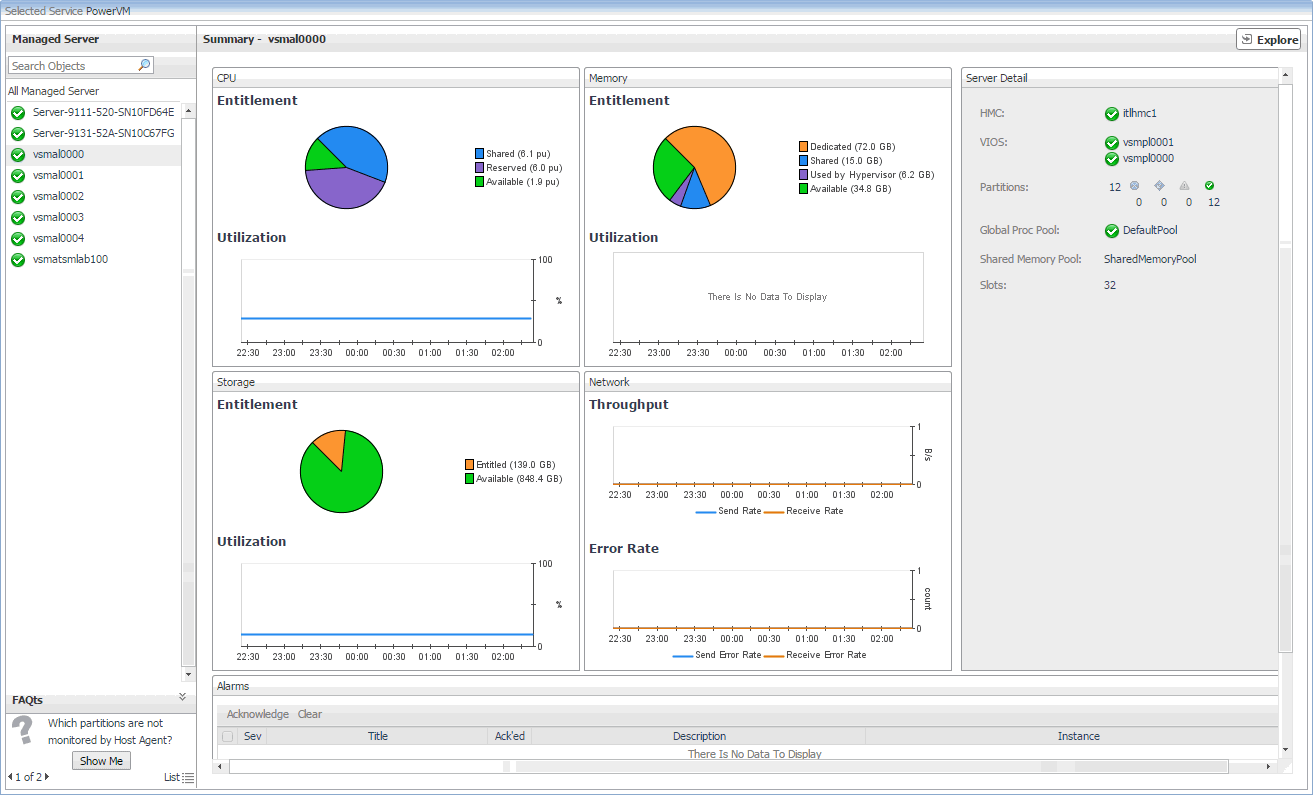
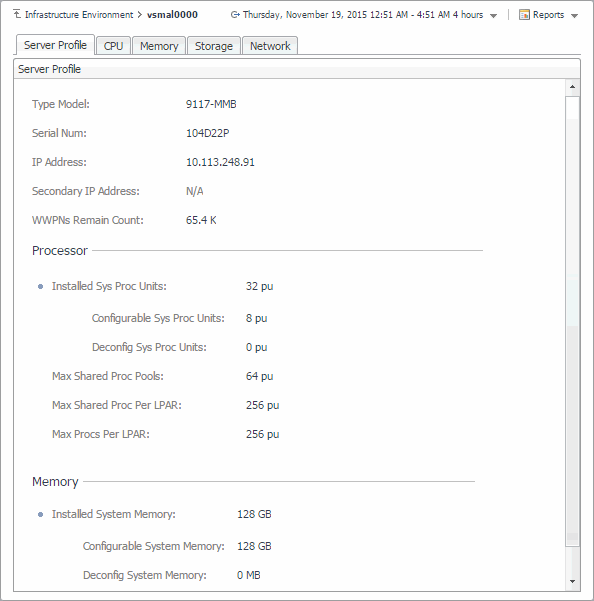
The Selected Service PowerVM view appearing immediately below the tiles allows you to select a specific instance of the tile selection. From here, you can drill down on a desired object instance, and review the metrics associated with the selected object.

Observing alarms

If any alarms are generated against certain types of monitored objects, they appear along the bottom of the summary view on the right. Drill down on an alarm to find out what triggered it. The information appearing in the alarm dialog box can help you understand the cause of the problem, and suggest the steps you can take to further investigate the related issue.

Reviewing FAQts

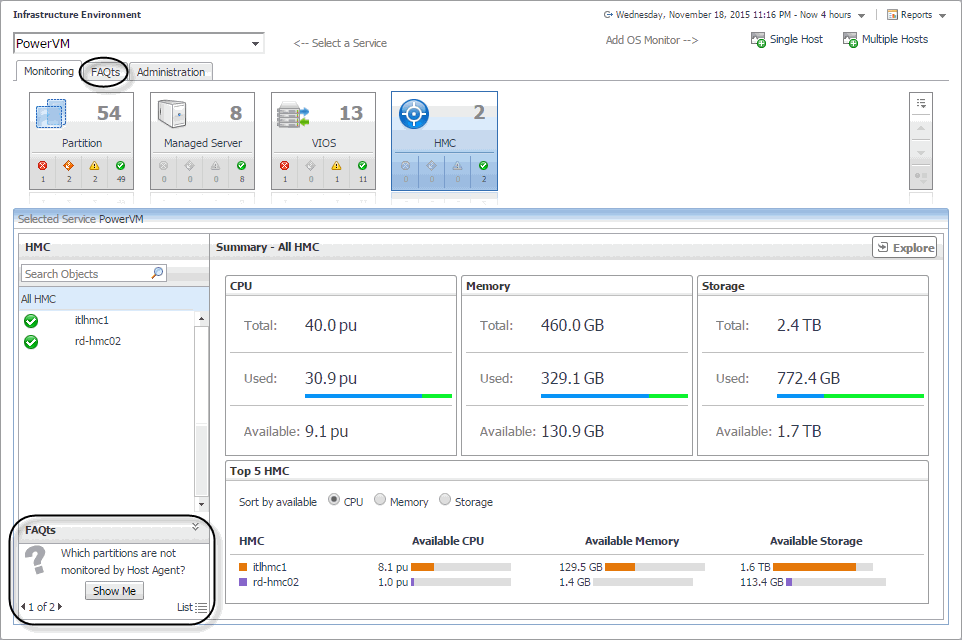
The bottom-left corner of the Monitoring tab allows you to navigate through commonly asked questions associated with the selected object type, and to review their answers. You can also review these questions using the FAQts tab. For more information, see Reviewing frequently asked questions.

Figure 16. FAQts view

相关文档

The document was helpful.

选择评级

I easily found the information I needed.

选择评级