Gauge charts
he data of CPU, memory, network, and disk usage are represented using a spinner (also known as rotating wheel) which is divided into four severity levels, including Normal (in green), Warning (in yellow), Critical (in orange), and Fatal (in red).
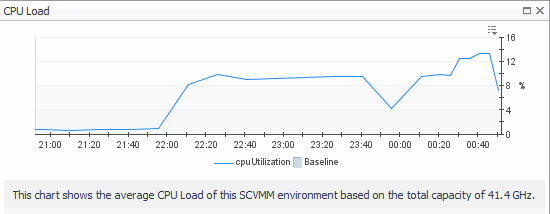
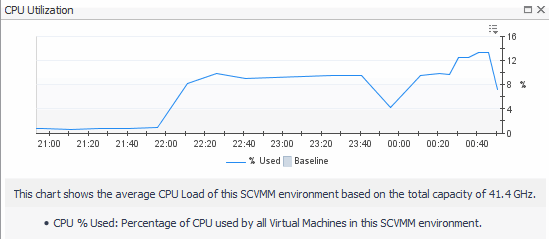
The severity of CPU Load is calculated based on the following formula: (utilization current average - utilization period average)/utilization period standardDeviation. If this value is:
The severity of Network I/O is calculated based on the following formula: (transferRate current average - transferRate period average)/transferRate period standardDeviation. If this value is:
The severity of Memory Load is calculated based on the following formula: (currentPressure current average - currentPressure period average)/currentPressure period standardDeviation. If this value is:
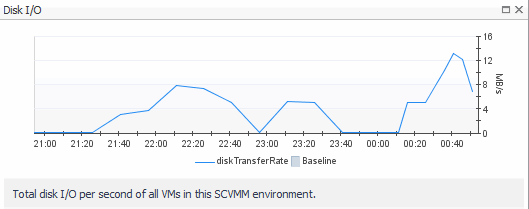
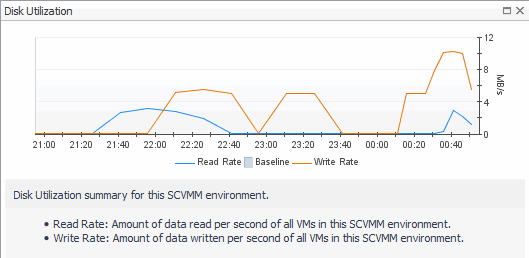
The severity of Disk usage is calculated based on the following formula: (diskTransferRate current average - diskTransferRate period average)/diskTransferRate period standardDeviation. If this value is:

|
• |
Summary: Includes the following embedded views: |
|
• |
SCVMM Inventory: Includes the following embedded views: |
|
|
Indicates the overall information of the selected SCVMM server. |
|
|
SCVMM Resources. Shows the CPU and memory information.
|
• |
Monitored: Shows the number of CPU and memory of Hyper-V servers that are managed by the selected SCVMM server and are also monitored by the Hyper-V agents. |
|
• |
Total: Shows the numbers of CPU and memory that are managed by the selected SCVMM server. | |
|
|
Virtual Machines. Shows the VM related information.
|
• |
Monitored: Shows the number of VMs/running VMs that are managed by the selected SCVMM server and are also monitored by the Hyper-V agents. |
|
• |
Total: Shows the total number of virtual machines that are managed by the selected SCVMM server. | |
|
|
Hosts. Shows the list of hosts available in the selected SCVMM Server. |
|
|
Host Groups. Shows the number of host groups available in selected SCVMM Server. |
|
|
Clouds. Shows the number of clouds available in the selected SCVMM Server. |
|
|
SCVMM Server. Shows the state of the selected SCVMM Server, including Host Name, IP, Uptime, Database Host, Database Name, and Database State.
If there are no IP and Uptime metrics displayed in the SCVMM Server area, this should be caused by one of the following:
|
Foglight Resource Optimizer for Hyper-V Environments
With virtual machines quickly becoming the industry standard in an IT infrastructures, making it necessary to plan for the addition of virtual machines to the physical hosts. This is often a challenge for administrators. Foglight Evolve Cloud® Resource Optimizer simplifies the optimization process, providing waste-finding and right-sizing functionality for virtualized environments.
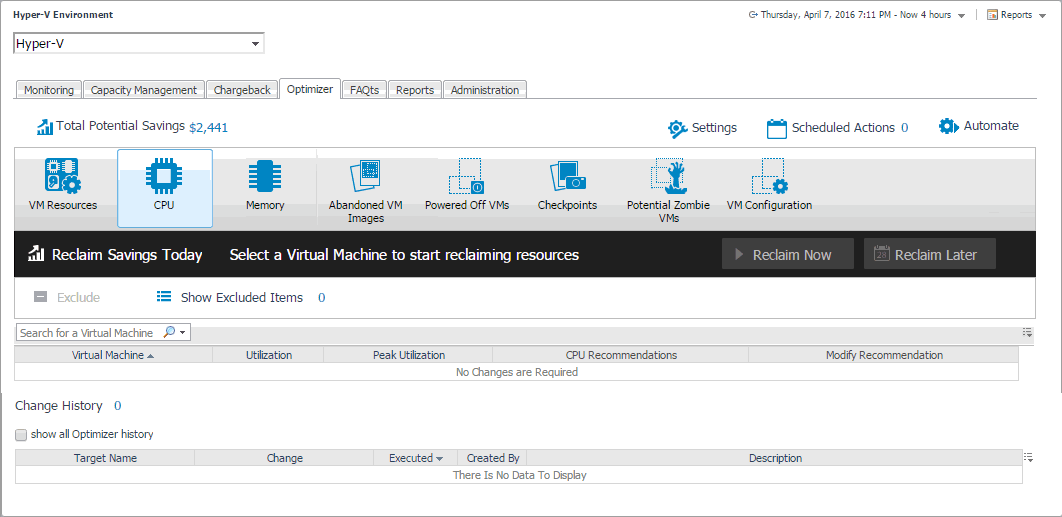
Resource Optimizer for Hyper-V Environments
Performance investigation with the Hyper-V Explorer
The Hyper-V Explorer provides a great deal of value to administrators who leverage Hyper-V Monitoring in Foglight® Evolve Cloud to monitor their virtual infrastructure. It has a hierarchical interface that displays various performance metrics and alarms within the virtual infrastructure. It provides several informative views through which you can quickly and easily access detailed information about any of the available components (physical or virtual) within the monitored environment.
About the Hyper-V Explorer
The Hyper-V Explorer provides detailed performance metrics about an object or a group of objects selected on the Hyper-V Explorer Topology tab.The upper part of the Hyper-V Explorer consists of three main components: a selected tile, an alarm summary for the selected object, and navigation tabs.
The alarm summary in the top right shows the number of alarms at each severity level that are outstanding for the selected object type: clusters, servers, and virtual machines. Clicking an alarm count shows a list of the active alarms for the selected object or group of objects.
The range of navigation tabs varies from object to object, but generally includes a tab that displays the selected object’s summary (typically the default view), a tab displaying the selected object’s performance monitoring details, and one or more tabs with other relevant information. There are tabs that appear in the display area and a tab displaying a topology tree on the navigation panel. In addition, the action panel also provides instant access to a number of useful actions and tasks.