立即与支持人员聊天
与支持团队交流

Foglight for Exchange 5.7.2.3 - User and Reference Guide

Navigation basics Exploring the Foglight for Exchange dashboards Managing Exchange agents Reporting on your Exchange environment Foglight for Exchange views
Role views Exchange Server views Site views Cluster views Description of Embedded views
Agent State view Alarms view Auto Attendant Calls view Auto Attendant Directory Access view Auto Attendant General view Auto Attendant Transfers view Cached LDAP Searches/sec view CAS AB Load view CAS AB Service view CAS ActiveSync view CAS Control Panel Load view CAS Load view CAS OAB Download view CAS RPC Client Access view CAS RPC Client Access Load view CAS RPC HTTP view Client Access Features view Cluster Database Details view Cluster Storage Group Details view Cluster Summary and Resource Information view Cluster Summary view Clusters Listing view CPU view Disk view Domain Controllers view Edge Agent view Edge Transport Features view Exchange Roles Server Summary view Exchange Server Roles view (reference information) Exchange Servers in This Cluster view Exchange Servers view (Exchange Cluster Environment Summary) Exchange Servers view Host Monitor view Hub Transport Features view IP Address view Mailbox Features view Mailbox Store Assistant view Managed Availability Recovery Action Results view Memory view Network view Processes LDAP Read Time view Resource Utilization view Roles Listing view Roles Explorer view Role Features State view Roles Top 3 view Server Health view Server Listing view Servers in Site view Servers In This Site view Site By Category view Site Listing view Store Calendar Attendant view Store Client Search view Store Content Indexing view Store Database view Store Public Load view Store Resource Booking view Store RPC Client Throttling view Store Transport view Store User Load view Summary and Resource Information view Top 3 CPU Consumers view Top 3 Memory Consumers view Top 3 Network Consumers view Top 3 Storage Consumers view Total LDAP Read Time On All DCs view Total Long-Running LDAP Operations On All DCs view Transport Dumpster view Transport Edge Sync view Transport Extensibility Agent view Transport Load Store Drivers view Transport Queues view UM Availability view UM Call Answer General view UM Call Answer view UM Fax view UM General Current view UM General view UM Subscriber Access Calendar view UM Subscriber Access Directory view UM Subscriber Access General view UM Subscriber Access Message view Unified Messaging Features view Windows Services view
Foglight for Exchange rules Running diagnostic tests Managing Exchange metrics

Exchange Environment > Monitoring tab

The Monitoring tab provides a summary of the Exchange servers in your environment, the Exchange roles performed by these servers, and the sites where these servers reside. This tab consists of the following views:

The Exchange Environment Overview is located across the top of the Exchange Environment dashboard. It provides you with an overview of your Exchange environment.

The overview contains a tile for the following object types in your Exchange infrastructure: clusters, roles, servers, and sites. Each tile shows the number of corresponding objects of that type in your Exchange infrastructure as well as a count of objects of that type in each of the alarm states (fatal, critical, warning, and normal).

Clicking a tile displays summary information for that object type in the Quick View. Clicking an alarm state (for example, warning) on a tile displays summary information in the Quick View for the objects of that type that are in the selected alarm state.

The Quick View is located across the middle of the Exchange Environment dashboard. The following illustration is an example of the Server Quick View, displayed when the Servers tile is selected in the Exchange Environment Overview.

The Quick View displays summary information pertaining to the component selected from the Exchange Environment Overview and Object Tree view. For example,

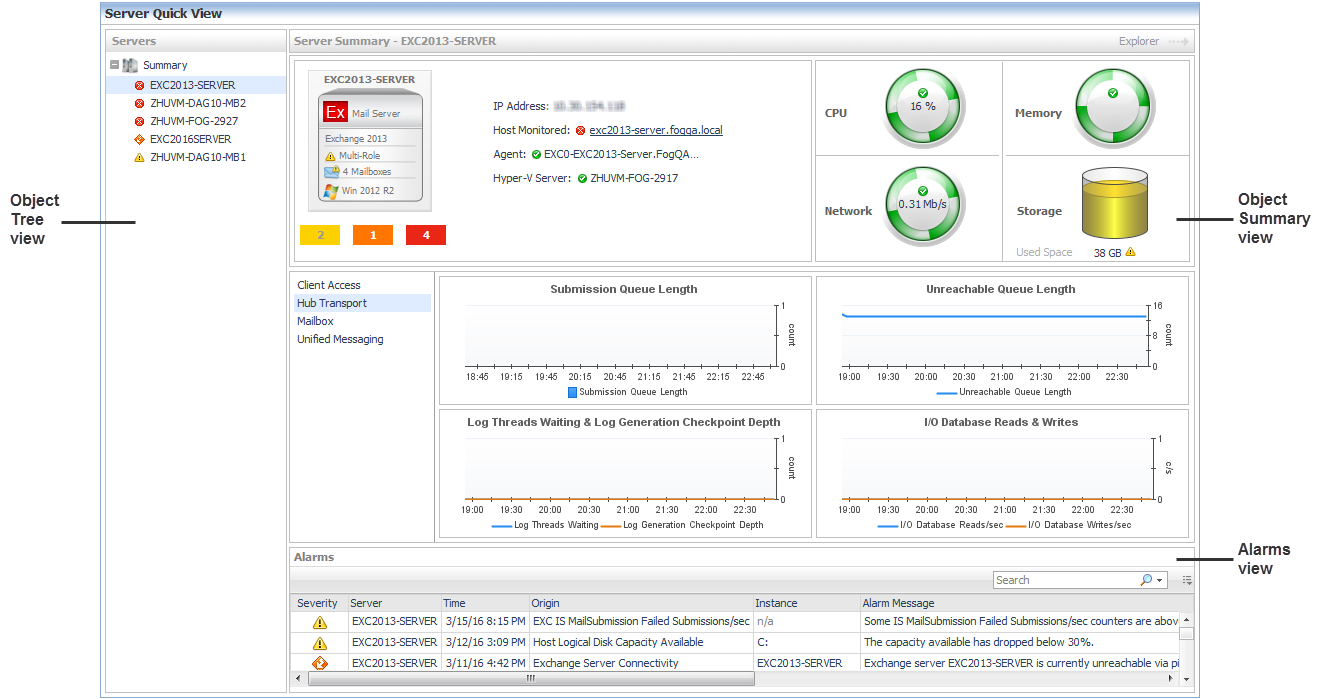
The Quick View consists of the following embedded views:

The Object Tree view is located at the left of the Quick View and displays objects based on the tile selected in the Exchange Environment Overview. Use the Object Tree view to select a single object or a group of objects of a particular type for display in the Object Summary view.

The Object Summary view is located to the right of the Object Tree view and displays summary information for a single object or a group of objects, depending on what is selected in the Object Tree view.

The Object Summary view displays a number of embedded views which is determined by the item selected in the Exchange Environment Overview and Object Tree view. It provides a quick and easy view into the items that make up the selected Exchange object and the alarm states of these items.

In addition, at the top right of the Object Summary view there is an Explorer link. This enables you to quickly navigate to the Exchange Explorer dashboard for more detailed metrics about the selected object or group of objects.

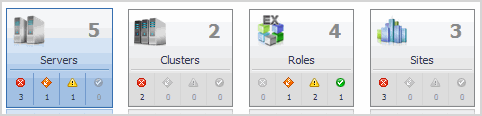
The following table lists the information displayed when the different object tiles are selected.

Roles Tile

Summary

Exchange Roles Environment Summary (All Exchange Roles) view

Roles Tile - Alarm Indicator

Summary

A summary of all Exchange roles defined in your environment, in the selected state.

For details, see Exchange Roles Environment Summary (All Exchange Roles) view.

Roles Tile or Alarm Indicator

Role Item

One of the following views:

Servers Tile

Summary

Exchange Servers Environment Summary (All Exchange Servers) view

Servers Tile - Alarm Indicator

Summary

A summary of all Exchange servers in your environment, in the selected state.

For details, see Exchange Servers Environment Summary (All Exchange Servers) view.

Servers Tile or Alarm Indicator

Server Item

Exchange Server Environment Summary view

Sites Tile

Summary

Exchange Sites Environment Summary (All Sites) view

Sites Tile - Alarm Indicator

Summary

A summary of all sites in your environment, in the selected state.

For details, see Exchange Sites Environment Summary (All Sites) view.

Sites Tile or Alarm Indicator

Site Item

Exchange Site Environment Summary view.

Clusters Tile or Alarm Indicator

Cluster Item

Exchange Cluster Environment Summary view

The Alarms view that appears at the bottom of the Quick View in the Exchange Environment dashboard displays a sortable list of all the outstanding alarms for the item selected in the Object Tree view.

Exchange Environment > Administration tab

The Administration tab includes the following components, and allows you to perform administrative tasks, as follows:

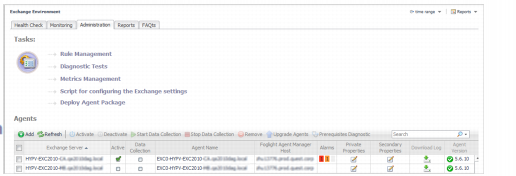
Deploy Agent Package: Deploy the Exchange agent package, create Exchange agent instances on one or more servers at a time, activate or deactivate Exchange agents, and start and stop collecting data.
Rule Management: View and manage rules that exist in your environment. For more information, see Foglight for Exchange rules.
Diagnostic Tests: View a list of diagnostic tests that are available, as well as run a test immediately or define a schedule for when a test is to be run. For more information, see Running diagnostic tests.
Metrics Management: View, edit, and enable/ disable the optional metric collections that are configurable for Exchange agents. For more information, see Managing Exchange metrics.
Script for configuring the Exchange settings: Download and run a script that automatically configures the Exchange servers.

Exchange Environment > Reports tab

The Reports tab allows you to manage custom Exchange reports. It consists of the following components:

From the Tasks list, you can create a report, copy an existing report, or edit an existing report for your Exchange environment:

Click Create a Report to select and generate a report using the Create a Report wizard.
Click Copy Existing Report to duplicate an existing report using the Copy Existing Report wizard.
Click Edit Existing Report to modify an existing report using the Edit Existing Report wizard.
1
Start the Create a Report wizard.
2
On the Basic Configuration page, define the following settings, then click Next:
Scheduled Report Name: Type a valid name for the report.
Report Templates: Select the template on which you want to base your report. The Report Inputs section is populated with the template’s report parameters. Use the default parameters to quickly create a report, or optionally change the report parameters to customize the report to better meet your requirements. For more details about Exchange template reports, see Foglight for Exchange reports.
3
On the Advanced Configuration page, define the following settings, then click Finish:
Schedule: Select the report schedule from the list of available options.
Retained Results: Type the number of results retained for the report.
Enabled: Select the check box if you want to enable the report. Clear the check box if you want to disable the report.
Report Format: Select the report format from the list of available options.
Email Recipients: Type the email addresses of the recipients to be notified when the report is generated.
1
Start the Copy Existing Report wizard.
2
On the Select Report page, select the report to be copied, then click Next.
3
On the Edit Report Configuration page, define the following settings, then click Finish:
Scheduled Report Name: Type a valid name for the new report.
Report Templates: The report template can not be modified, only the report parameters in the Report Inputs section at the bottom of the page.
Schedule: Select the report schedule from the list of available options.
Retained Results: Type the number of results retained for the report.
Enabled: Select the check box if you want to enable the report. Clear the check box if you want to disable the report.
Report Format: Select the report format from the list of available options.
Email Recipients: Type the email addresses of the recipients to be notified when the report is generated.
1
Start the Edit Existing Report wizard.
2
On the Select Report page, select the report to be edited, then click Next.
3
On the Edit Report Configuration page, define the following settings, then click Finish:
Scheduled Report Name: Change the report name, as necessary.
Report Templates: The report template and its parameters can not be modified.
Schedule: Select the report schedule from the list of available options.
Retained Results: Type the number of results retained for the report.
Enabled: Select the check box if you want to enable the report. Clear the check box if you want to disable the report.
Report Format: Select the report format from the list of available options.
Email Recipients: Type the email addresses of the recipients to be notified when the report is generated.

The Recent Report History view provides information about the most recent report instances run in your environment.

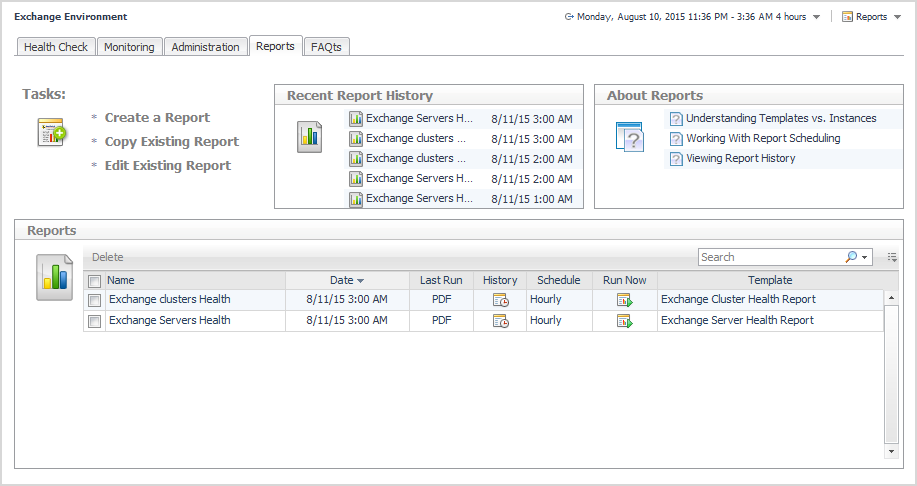
The About Reports view enables you to get answers to common questions about Exchange reports.

Clicking a question from the list displays a dialog box that provides information about the selected topic.

The Reports view displays all of the report instances configured in your Exchange environment.

The view contains the following information for each configured report instance.

Use the selection check boxes to select report instances for running or removal.

Name

Displays the name of the report.

Date

Indicates the date and time when the report was last run.

Last Run

Indicates the report type.

History

Click the icon in this column to open the Report History dialog box, and review the history of the selected report. To view the report content, click one item in the list.

Schedule

Displays the time when the report is scheduled to run.

Run Now

Click the icon in this column to manually run a selected report. The Run Now dialog box opens, displaying the status of the report generation. When the report is complete, you can view the report content by clicking the Download.

Template

Displays the template used for a scheduled report.

To delete one or several reports from the list, select the report(s) and click the Delete button at the top left corner of the view.

To search for a particular report, type the report name on the Search box at the top right corner of the view, then click Enter.

Exchange Environment > FAQts tab

The FAQts view appears as a navigation tab at the top of the Exchange Environment dashboard. It provides a list of all the questions available for all Exchange object types.

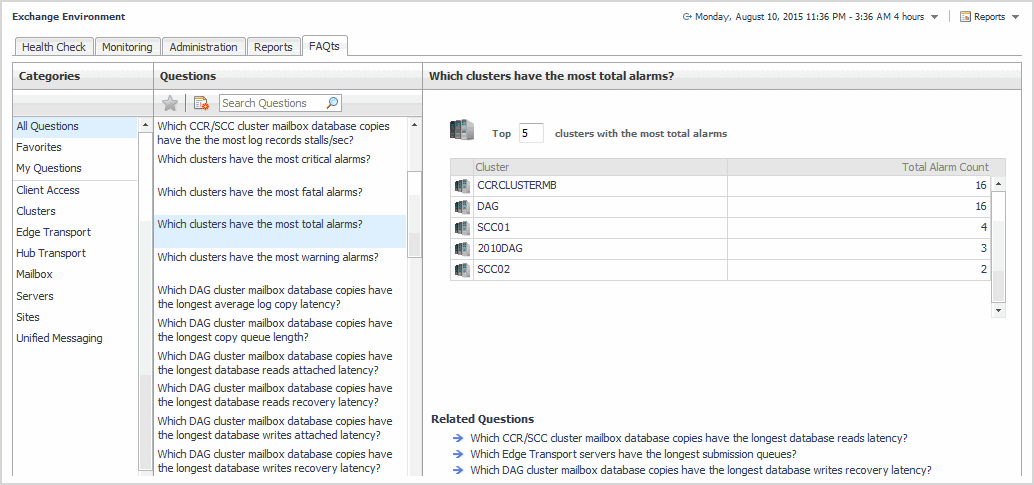
The FAQts view enables you to get answers to common questions about your Exchange environment.

Figure 13. FAQts view

The FAQts navigation tab is made up of the following embedded views:

The Categories view lists the categories (that is, servers, sites, Mailbox role, Client Access role, Unified Messaging role, Hub Transport role and Edge Transport role) for which questions can be answered by Foglight. It also contains a Favorites and My Questions category which allows you to customize the list of questions displayed.

By default, All Questions is selected. Click a category to view a list of questions relating to a type of Exchange object or click Favorites or My Questions to view your customized list of questions.

The Questions view lists the questions available for the category selected in the Categories view.

Click a question from the list to have Foglight gather and report an answer.

Use the buttons at the top of the Questions view as follows.

Mark the selected question as a ‘favorite’. Questions marked as a ‘favorite’ will be displayed when the Favorites category is selected.

Create a report based on selected questions.

If the list of questions is long, you can narrow it down by entering a text string in the Search field. Enter a word or text string and select the search button to display only those questions that contain the word or string entered.

To clear the filter and return to the original list of questions, click .

The Answer view provides an answer to the question selected in the Questions view. The answer is provided in the following form:

Top x <objects of category> ...

where x is the number of objects of the category selected in the Categories view.

It also lists related questions from which you can select. Selecting a related question will refresh the Answer view displaying the answer to the selected question.

相关文档

The document was helpful.

选择评级

I easily found the information I needed.

选择评级