Memory Drill-downs
The Memory drill-down provides access to:
Provides memory summary metrics on the members and memory pools for the selected database.
Select Whole Database or a member within the selected database from the list at the top of the pane.
On the Database home page toolbar, click Memory and select Memory Summary.

|
|
|
• |
DB Memory. Displays the total memory allocated to the selected database. | |
|
|
|
• |
Pool Allocated Size. Displays a breakdown of the total memory allocated to the members of the selected database using a bar chart. | |
|
|
|
• |
Pool Breakdown. Displays a breakdown of the total memory allocated to the members of the selected database using a pie chart. | |
|
|
|
|
• |
Utilization %. The percentage of configured allocated memory that is in use. | |
|
|
|
• |
Allocation. The average allocated size (in KB) of a memory pool. | |
|
|
|
• |
Config Size. The internally configured size (in KB) of a memory pool in the DB2 database system. | |
|
|
|
• |
Alarm. The alarm count and state of the member or memory pool. Click an alarm count to view information about the alarm on the Outstanding Alarms dialog box. For complete information about alarms in Foglight, see the Foglight User Help. | |
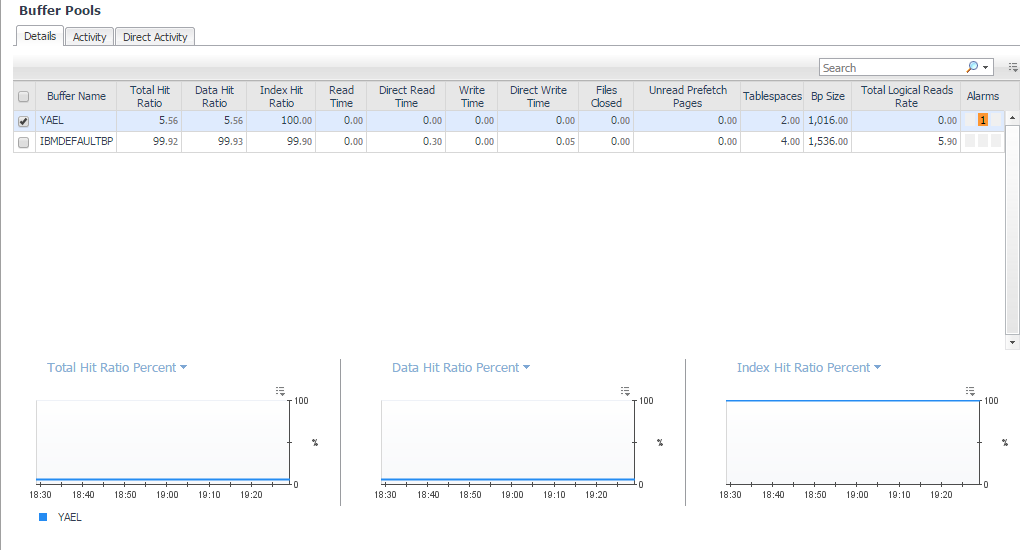
Provides performance metrics on the buffer pools for the selected database.
On the Database home page toolbar, click Memory and select Buffer Pools.
This view provides the following embedded views:
The Details tab displays a top-level summary of the buffer pools. The tabs in the lower portion of the view display graphs of the various metrics over time.
|
|
|
|
• |
Total Hit Ratio. A measure of how often a page access (getpage) is satisfied without requiring an I/O operation. | |
|
|
|
• |
Tablespaces. The number of tablespaces using this buffer pool. | |
|
|
|
• |
Data Hit Ratio. A measure of how often a data page access (getpage) is satisfied without requiring an I/O operation. | |
|
|
|
• |
Index Hit Ratio. A measure of how often an index page access (getpage) is satisfied without requiring an I/O operation. | |
|
|
|
• |
XDA Hit Ratio. A measure of how often an XML storage object (XDA) page access (getpage) is satisfied without requiring an I/O operation. | |
|
|
|
• |
pureScale only — GBP Hit Ratio. A measure of how many times a requested page was found in the GBP out of all times it was requested. | |
|
|
|
• |
Col Hit Ratio. A measure of how often a column-organized page access is satisfied without requiring an I/O operation. Available for version 10.5 and above. | |
|
|
|
• |
Read Time. Indicates the total amount of time (in seconds) spent reading in data and index pages from the tablespace containers (physical) for all types of tablespaces. | |
|
|
|
• |
Write Time. Provides the total amount of time spent (in seconds) physically writing data or index pages from the buffer pool to disk. | |
|
|
|
• |
Direct Reads Rate. The number of read operations that do not use the buffer pool, per second. | |
|
|
|
• |
Direct Writes Rate. The number of write operations that do not use the buffer pool, per second. | |
|
|
|
• |
Direct Read Time. The elapsed time (in seconds) required to perform the direct reads. | |
|
|
|
|
|
|
• |
Files Closed. The total number of database files closed. This element can be used to help with determining the best value for the maxfilop configuration parameter. | |
|
|
|
• |
Unread Prefetch Pages. Indicates the number of pages that the prefetcher read in that were never used. If this number is high, prefetchers are causing unnecessary I/O by reading pages into the buffer pool that are not being used. | |
|
|
|
• |
Alarms. The alarm count and state of the member or memory pool. Click an alarm count to view information about the alarm on the Outstanding Alarms dialog box. For complete information about alarms in Foglight, see the Foglight User Help. | |
|
|
|
• |
Size. The current buffer pool size in pages. | |
|
|
|
• |
Col Logical Reads. Indicates the number of column-organized pages requested from the buffer pool (logical) for regular and large table spaces. |
|
|
|
|
• |
Col Logical Reads Rate. Indicates the number of column-organized pages which have been requested from the buffer pool (logical) for regular and large table spaces per second. |
|
|
|
|
• |
Col Physical Reads. Indicates the number of column-organized pages read in from the table space containers (physical) for regular and large table spaces. |
|
|
|
|
• |
Col Physical Reads Rate - Indicates the number of column-organized pages read in from the table space containers (physical) for regular and large table spaces, per second . |
|
|
|
|
• |
Automatic. Indicates whether the buffer pool has self-tuning enabled. 1 indicates self-tuning is enabled for the buffer pool, and 0 otherwise. | |
Displays graphs of read and write metrics for the buffer pools against a baseline.
|
|
|
|
|
|
|
|
|
|
|
|
• |
Data Logical Reads Rate. The number of data logical reads per second, which includes accesses to data pages that are already in the buffer pool when the database manager needs to process the page. Also includes data pages that are read into the buffer pool before the database manager can process the page. | |
|
|
|
• |
Data Physical Reads Rate. The number of data pages read in per second from the tablespace containers (physical) for regular and large tablespaces. | |
|
|
|
• |
Index Logical Reads Rate. The number of index logical reads per second, which includes accesses to index pages that are already in the buffer pool when the database manager needs to process the page. Also includes index pages that are read into the buffer pool before the database manager can process the page. | |
|
|
|
• |
Index Physical Reads Rate. The number of index pages read in per second from the tablespace containers (physical) for regular and large tablespaces. | |
Displays graphs of direct reads and direct writes metrics to the buffer pools. For metric descriptions, see Buffer Pools — Details tab.
Storage Drill-downs
The Storage drill-down provides access to:
Tablespaces
The Tablespaces Pane provides metrics and graphs of the top 10 tablespace activities and summarizes tablespace usage. This pane provides the following views:

On the Database home page toolbar, click Storage and select Tablespaces.
You can also access the Tablespaces pane for a database from the Databases Dashboard. Click the icon at the far right of the database name cell and selecting Tablespaces from the menu that appears.
Displays the 10 tablespaces which have the highest size or the highest percentage of space utilization, according to the user’s selection. The default selection for sorting graphically is space utilization. Selecting the alternate value updates the chart and the table.
|
|
|
• |
Show top by. Use the Show top by options to select metrics which display graphs for size and percentage of tablespace usage. Click the required metric representation to display the respective graph. |
The following graphs are provided:
|
• |
Size: Tablespace size over the last 30 days or during the timeframe selected (which ever is longer). |
|
• |
% Space Usage. Percent of the tablespace in use. Utilization is calculated after taking into account the type of the tablespace (SMS/DMS), its parameters (like auto extend), the free space on the file system and the IBM architecture size limitations. |
|
|
|
Axis Definitions: |
|
|
|
|
|
|
|
|
|
|
|

|
The Tablespaces Summary view shows the status for all the database tablespaces, including space usage in percent and state of the tablespace.
The Tablespace Summary view is located in the lower part of the Tablespaces pane.
|
|
|
|
|
|
• |
Total Size Used %. Tablespace utilization % including free space on the file sytstem and DB2 architecture limits | |
|
|
|
• |
Alarms. The number of warning, critical, and fatal alarms for this DB2 database tablespace. The dwell shows the most recent alarms raised against this tablespace, sorted by severity. Click this field to view the Alarms list. This list allows browsing through the alarms, which are sorted according to severity. See the Foglight Online Help, Monitoring System-Wide Alarms for details on the alarm information. | |
|
|
|
• |
Auto Resize. Relates to the DMS tablespaces and storage tables stored automatically. A setting of one indicates enablement of the auto resizing. | |
|
|
|
• |
Auto Storage. Describes whether the tablespace was created as an automatic storage tablespace. A value of 1 (Auto) means yes; 0 means no. | |
|
|
|
|
|
|
• |
Content Type. Text identifier defining the size or type of the tablespace: ANY, LARGE, SYSTEMP, or USRTEMP. | |
|
|
|
• |
ID. Numerical identification of the tablespace. | |
|
|
|
• |
Name. The name of the tablespace. Clicking the tablespace name drills down further to the Tablespace-specific page. | |
|
|
|
|
|
|
• |
Rebalancer Mode. Indicates if the current re-balancing process is removing space from a tablespace or adding space to a tablespace. |
|
|
|
|
• |
State. Text identifier of the tablespace state. | |
|
|
|
• |
Total Size. The total amount of allocated space (in megabytes) in this tablespace. | |
|
|
|
• |
Type. Text identifier of DMS or SMS. | |
|
|
|
• |
MAX ARCHITECTURE SIZE TB - Maximum size allowed by DB2 for a tablespace as reported in the DB2 docs. Size is given in TB. -1 indicates limit is not relevant | |
|
|
|
• |
MAX ARCHITECTURE SIZE pages - Maximum size allowed by DB2 for a tablespace as reported in the DB2 docs . Size is given in Mega pages (1 means 1 million pages). -1 indicates limit is not relevant. | |
|
|
|
• |
FS Free Size MB - Total amount of free space left on all file system used by the tablespace. Size is given in MB | |
|
|
Clicking the tablespace name drills down to the Tablespace-specific page.
For more information, see Tablespace-specific Page. |
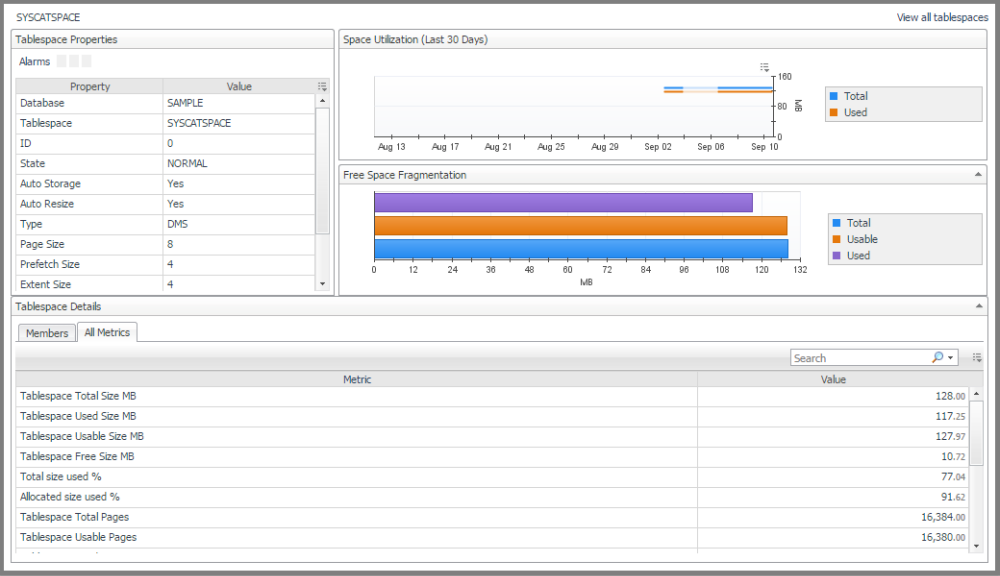
This page provides details on tablespace properties and space utilization, allowing you to analyze any issues affecting the selected member.
From the Tablespaces pane, click the required tablespace in the Top 10 Tablespaces view or the tablespace name in the Tablespace Summary view.
This pane is made up of the following views.
This view provides the following panes:
|
|
|
• |
Alarms. The number of warning, critical, and fatal alarms for this database tablespace. The dwell shows the most recent alarms raised against this tablespace, sorted by severity. |
Clicking an alarm displays an alarm management pop-up. |
|
|
|
• |
Auto Resize. Relates to the DMS tablespaces and storage tables stored automatically. A setting of 1 indicates enablement of the auto resizing. | |
|
|
|
|
|
|
• |
Content Type. Text identifier defining the size or type of the tablespace: ANY, LARGE, SYSTEMP, or USRTEMP. | |
|
|
|
|
|
|
|
|
|
|
|
|
• |
Prefetch Size. The highest number of pages a pre-fetcher receives from a disk for a given time. If this function is enabled, a value of -1 displays. | |
|
|
|
• |
Rebalancer Mode. Shows the direction of rebalancing and whether this process is adding or removing tablespaces. | |
|
|
|
• |
State. Text identifier of the database state. | |
|
|
|
|
|
|
• |
Type. Text identifier of DMS or SMS. | |
The Tablespace Details view provides the following tabs:
Tablespaces Buffer Pool Activities
Provides the metrics required to monitor tablespace buffer pool activities and can be sorted according to the buffer pool hit ratio.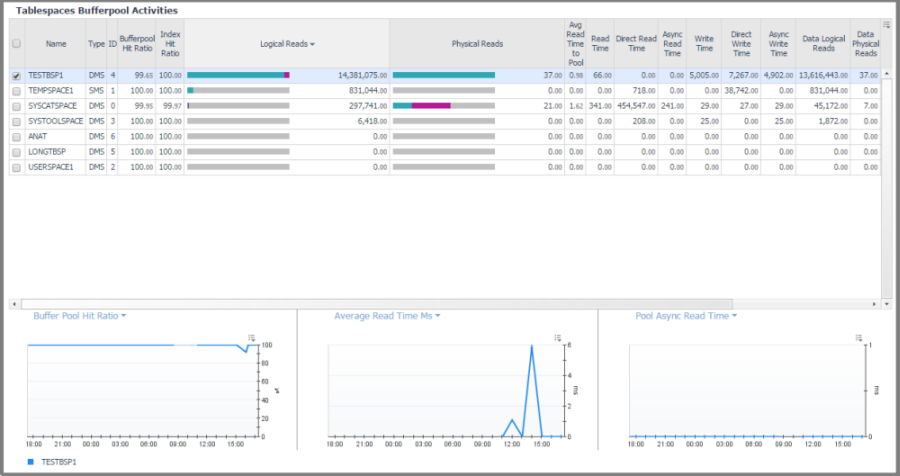
On the Database home page toolbar, click Storage and select Tablespaces Bufferpool Activities.
This pane provides the Tablespaces Bufferpool Activities view.
Displays the top tablespaces buffer pool activities metrics and allows you to choose the tablespace to plot and view charts on the details and performance of the selected tablespace. The tablespaces are sorted according to the buffer pool hit ratio.
|
|
|
• |
Async Read Time. The time (in milliseconds) spent on reading data pages by database manager prefetchers. | |
|
|
|
• |
Async Write Time. The time (in milliseconds) spent on writing data or index pages by database manager prefetchers. | |
|
|
|
• |
Bufferpool Hit Ratio. The percentage of read requests that are satisfied by the buffer pool without having to physically read from the disk. | |
|
|
|
• |
Data Logical Reads. The number of logical read requests for data pages that go through the buffer pool. | |
|
|
|
• |
Data Physical Reads. The number of physical (disk) read requests for data pages that do not go through the buffer pool. | |
|
|
|
|
|
|
|
|
|
|
|
|
• |
Index Hit Ratio. The percentage of read requests for index pages that are satisfied without having to read from the disk. | |
|
|
|
• |
Index Logical Reads. The number of logical read requests for index pages that are satisfied without having to read from disk. | |
|
|
|
• |
Index Physical Reads. The number of physical (disk) read requests for index pages that need to read data from disk. | |
|
|
|
|
|
|
• |
Name. The tablespace name. | |
|
|
|
• |
Read Time. The amount of elapsed time (in milliseconds) spent on processing read requests. | |
|
|
|
• |
Type. The tablespace type (DMS Database-Managed Space) or SMS (System-Managed Space). | |
|
|
|
• |
Write Time. The amount of elapsed time (in milliseconds) spent on processing write requests. | |
|
|
|
• |
Total logical reads. Total pages read from the bufferpool. count all page types : data, index, XDA and column-organized . | |
|
|
|
• |
Total physical reads. Total pages read from the table space containers (physical) to the pool. Count all page types : data, index, XDA and column-organized. | |
|
|
|
• |
Col logical Reads. Total number of column-organized pages requested from the buffer pool (logical). |
|
|
|
|
• |
Col Physical Reads. Total number of column-organized pages read in from the table space containers (physical). |
|
|
|
|
• |
Col Hit Ratio. Percentage of column-organized pages reads that were carried out from the buffer pool for the selected tablespace, without having to perform physical reads. |
|
|
|
|
• |
GBP Logical Reads. The number of pages read from the Group Buffer Pool (GBP) because the page was either invalid or not present in the Local Buffer Pool (LBP). Only relevant for a puresclae instance. | |
|
|
|
• |
GBP physical reads. The number of Group Buffer Pool (GBP) dependent pages that were read into the local buffer pool from disk because it was not found in the GBP. |
|
|
|
|
• |
GBP Hit Ratio. The percent of time a requested page was found in the group bufferpool out of all times it was requested. If a page is found in the GBP it saves the database the time to look for it in the Local Buffer Pool. Only relevant for a puresclae instance. | |
|
|
|
• |
Avg Read Time to Pool. The average time it takes to read a single page from the table space containers (physical) to the buffer pool. value is given in milliseconds. | |
|
|
One or more tablespace entries can be viewed by selecting them in the table. The graphs in the lower pane sho the information for the selected tablespaces. |