立即与支持人员聊天
与支持团队交流

Foglight for Active Directory 5.7.2 - User and Reference Guide

Navigation basics Exploring Foglight for Active Directory dashboards Managing Active Directory agents Reporting on your Active Directory enterprise Foglight for Active Directory views
Forest views Domain views Site views Domain Controller views Description of embedded views
Address Book view Agent State view Asynchronous Thread Queue view Core Services view Database Access view Database Cache view Database Log Access view Database Performance Health view Defragmentation Tasks view DFS Namespace Service API Queue view DFS Namespace Service API Requests view DFS Namespace Service Referrals view DFS Replicated Folders view DFS Replication Connections view DFS Replication Service Volumes view DFS-R Performance Health view Directory Replication Inbound view Directory Replication Outbound view Directory Replication Sync view Directory Replication USN view Directory Services General view Directory Services Performance Health view Directory Services Reads view Directory Services Searches view Directory Services Writes view Domain Controller Details view Domain Controllers view FileReplicaConn Authentications/Bindings view FileReplicaConn Change Orders view FileReplicaConn Fetch view FileReplicaSet Authentications/Bindings view FileReplicaSet Change Orders view FileReplicaSet DS Communications view FileReplicaSet Files view FileReplicaSet Local Change Orders view FileReplicaSet Packets view FileReplicaSet Remote Change Orders view FRS Performance Health view FRS Replica Sets view FRS Staging Files view FSMO Roles view (Domain) FSMO Roles view (Forest) Host Monitor view Inter-Site Transports view Inventory By Category view IP Subnets view Key Distribution Center view LDAP view Memory view Network view Processor view Replication Performance Health view Resource Utilization view Security Accounts Manager view Server Health view Statistics view Storage view Summary and Resource Information view Top AD Metrics view Top 3 Consumers view Top 3 CPU Consumers view Top 3 DS Directory Reads/sec view Top 3 LDAP Bind Times view Top 3 Memory Consumers view Top 3 Network Consumers view Top 3 Replication Queue Length view Top 3 Storage Consumers view Trusts view USN Records view
Foglight for Active Directory rules Running diagnostic tests Managing Active Directory metrics

USN Records view

To display this view, enable the USN Records Group in the FRS section of the Metrics Management dashboard. When this collection group is enabled, this view is added to the FRS navigation tab for the selected DC in the Active Directory Explorer dashboard.

This view displays metrics related to Update Sequence Number (USN) records on the selected DC which are gathered when the USN Records collection group is enabled.

USN Records. This graph charts the following metrics over the specified time interval:

USN Reads. Shows the number of times FRS has initiated a read on the NTFRS change log.
USN Records Examined. Shows the number of times the NTFRS change log records have been examined by FRS.
USN Records Rejected. Shows the number of times the NTFS change log records have been skipped by FRS.

Drill down on:


Foglight for Active Directory rules

Foglight for Active Directory includes a number of predefined rules to monitor all critical components of Active Directory® on a continuous basis to ensure that the directory is functioning properly. The rules included in this cartridge alert you to key conditions that may affect the health of Active Directory. Foglight allows you to modify these predefined rules or create your own rules to ensure you are monitoring statistics and alerting on conditions specific to your Active Directory environment.

Foglight for Active Directory provides an additional dashboard that can be used to manage the cartridge’s rules. That is, Foglight for Active Directory rules can be managed using one of the following dashboards:

Rules dashboard (Dashboards > Administration > Rules >All)
Active Directory Rule Management dashboard (Dashboards > Active Directory > Rule Management)

This section describes the Active Directory Rule Management dashboard and explains the tasks that can be performed from this dashboard:

Rules dashboard

The Rules dashboard lists all rules that exist in your environment and allows you to drill down to rule definitions. From this dashboard you can copy, edit, and remove Foglight rules.

1
In the navigation panel, under Homes, click Administration.
2
In the Administration dashboard, click Rules > All.

Active Directory Rule Management dashboard

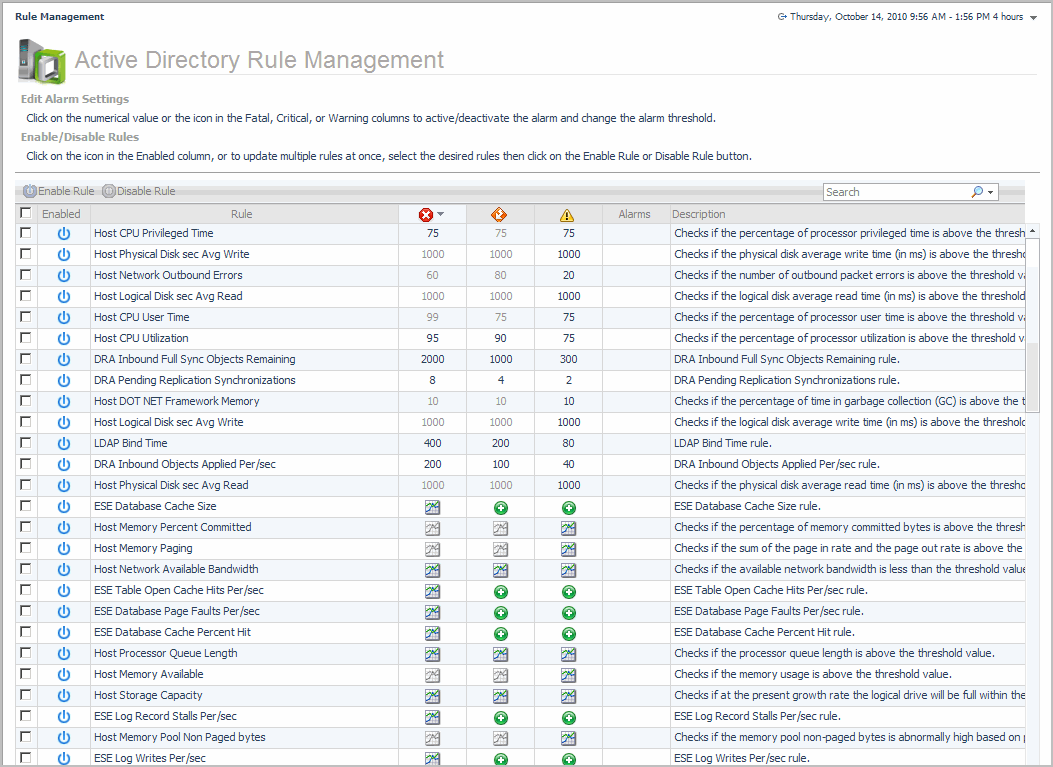
The Active Directory Rule Management dashboard contains a sortable list of all the conditional severity rules used by Foglight for Active Directory. From this dashboard you can quickly see which conditional rules are enabled/disabled, the states (fatal, critical or warning) with active conditions, predefined alarm threshold values, rules with current alarms, and a brief description of each rule.

The Active Directory Rule Management dashboard displays the following information about Foglight for Active Directory rules.

Use the selection check box column to select one or more rules in the list. Once selected, you can enable or disable the selected rules using the buttons at the top of the table.

To select or clear all of the rules in the list, click on the check box in the heading row.

Enabled

Displays one of the following icons indicating whether the rule is enabled or disabled:

- Enabled

- Disabled

Clicking the icon in this column will either disable or enable the selected rule.

Rule

Displays the name of the rule.

Selecting the rule name launches the rule editor where you can view or edit the selected rule.

Fatal Condition:

The set rule icon indicates that a fatal condition is not yet defined for this rule. Selecting this icon displays a dialog allowing you to specify a value for the rule or launches the rule editor allowing you to define a fatal condition for this rule.

Critical Condition:

The set rule icon indicates that a critical condition is not yet defined for this rule. Selecting this icon displays a dialog allowing you to specify a value for the rule or launches the rule editor allowing you to define a critical condition for this rule.

Warning Condition:

The set rule icon indicates that a warning condition is not yet defined for this rule. Selecting this icon displays a dialog allowing you to specify a value for the rule or launches the rule editor allowing you to define a warning condition for this rule.

Alarms

Indicates the number of outstanding alarms for each rule.

Selecting the number in this column displays the alarms popup. From the alarm list on this popup:

Available In

Indicates the Exchange version in which the rule is available.

Description

Provides a brief description of the rule.

相关文档

The document was helpful.

选择评级

I easily found the information I needed.

选择评级